Vacant Home Tax: What You Need to Know

A vacant home tax increases the housing supply by encouraging homeowners to sell or rent their unoccupied home, and if they choose to continue to keep the home vacant, a tax is levied. This revenue can then be used to fund affordable housing projects. The City of Toronto has proposed a vacant home tax in an effort to boost the city’s low housing supply and fund more affordable housing in the city.

How it Works

Mandatory Declaration of Occupancy Status

All residential property owners in Toronto will be required to declare the occupancy status of their property(s) annually, even if they live there. Declarations must be made by the homeowner or someone acting on behalf of the owner. The declaration will determine whether the Vacant Home Tax applies and is payable.

Vacant Home Tax Calculation

A Vacant Home Tax of one percent of the Current Value Assessment (CVA) will be imposed on all Toronto residences that are declared, deemed or determined vacant for more than six months during the previous year. For example, if the CVA of your property is $1,000,000, the tax amount billed would be $10,000 (1% x $1,000,000).

The tax is based on the property’s occupancy status for the previous year. For example, if the home is vacant in 2022 the tax will become payable in 2023.

How to Declare

To make a declaration you will need your 21-digit assessment roll number and customer number from your property tax bill or property tax account statement.

Declarations of occupancy status should be made through the City’s secure online declaration portal. If required, homeowners can complete a paper declaration form . The paper form must be completed in full and received by the City of Toronto before the deadline to avoid being issued a fine and having your property deemed vacant. Incomplete forms will not be accepted. The submission address is on the bottom of the declaration form. Please be aware of Canada Post delivery times. For the best user experience, use the free Adobe Acrobat Reader software to complete and save the fillable form.

For residential properties that are not occupied by the homeowner(s), an audit may be required. If the City conducts an audit, owners may be required to submit information or documentation about tenants and/or permitted occupants to confirm occupancy during the taxation period.

For residential properties declared as vacant for six months or more during the taxation year and without an eligible exemption, owners will be required to pay the Vacant Home Tax.

Owners of properties subject to the tax will be issued a Vacant Home Tax Notice in March/April and payment will be due on May 1.

Residential properties will be deemed vacant if the owner fails to make the annual declaration by the deadline and/or provide supporting documentation.

If there is an error in the declaration you submitted, you can:

  • submit a new declaration prior to the February 2 declaration deadline

  • file a Notice of Complaint if it is after the declaration deadline

Failure to declare or making a false declaration may result in a fine of $250 to $10,000.

For more information including types of occupancy, exemptions, change of ownership etc please visit the City of Toronto’s website: https://www.toronto.ca/services-payments/property-taxes-utilities/vacant-home-tax/

We're Dropping Decorating Dimes!

You could WIN a customized game night space in your house. Yes, in your house. Work with a top Canadian interior designer to elevate your in-home game viewing experience to your own personal taste. Did we mention this will all happen in your house? 

With a total prize value of $48,000, you might call it the ultimate assist from official real estate agents of the NBA.

*No Purchase Necessary. Legal Canadian residents, excluding Quebec. 21+. Other eligibility restrictions apply. Sweepstakes Period: October 25, 2022 at 12:00 am EST to November 21, 2022 at 11:59 pm EST. 3 Prizes available to be won. Grand Prize consists of the design of an NBA themed theatre room in the confirmed winner’s home (ARV: $48,000 CAD). Second prize consists of NBA swag package (ARV: $500 CAD). Third prize consists of NBA swag package (ARV: $500 CAD). Random draw to be conduct on or around November 22, 2022. Selected entrants must be confirmed as winners, including by correctly answering a skill-testing question. Odds depend on number of entries received. Sponsored by RE/MAX Promotions, Inc. Void where prohibited or restricted by law.

Official Rules: https://blog.remax.ca/yesinyourhouse/officialrules/

6 Tips for Selling your Home this Fall

Deciding to place your home on the market this fall? That’s great! Getting your home ready for sale is just as important in the fall and maintaining curb appeal requires different attention then in the spring and summer. Follow these six tips for selling your home this fall, and you might just get it sold before the last leaf falls.

Tips for Selling Your Home this Fall & Easy Fixes to Help Buyers Fall in Love

1. Don’t ‘Leave’ a Mess

While fall leaves are gorgeous to look at on trees, once they hit the ground they no longer add to the beauty of your property. Make a good first impression and get rid of leaves with a leaf blower or rake so the first thing sellers see is your home, not the amount of raking they will have to do each year! Clear walkways, your driveway and your lawn and be sure to pick up any stray branches as well.

2. Fall for Flowers

Gardens and landscaping can add to curb appeal when selling your home. Decaying plants, especially at the front of your home, don’t exactly say, welcome. If your summer flowers have died, it’s best to replace them or remove them.  Consider planting mums or fall flowers in flower beds and adding fresh mulch. (Mums can withstand cooler weather and come in beautiful fall colours). If you don’t have a garden or prefer not to plant flowers in them, try using urns or large pots instead.

3. Don’t be a Bore, Paint your Door

A freshly painted front door in a complimentary colour can give your home an upgraded look and help set it apart from other homes in the neighbourhood. Early fall, before wet and cold weather hits is perfect for painting as the summer humidity and bright sun can cause a paint job to peel or crack. Another way to dress up your door is to change the hardware. Having new locks or handles without scratches or dents in an updated finish can make your door seem like new. This attention to detail can make the right first impression as buyers enter your home.

Hint: Choose a colour that will brighten up your façade and compliment your brick. While it’s best to keep exterior paint colours neutral on windows, garage doors and siding, the front door is a chance to use colour. Have grey brick? Consider a deep red or blue. Not sure what to choose? Ask a RE/MAX agent for staging advice or download

4. Lighten Up

Let’s face it without the summer sun, on darker days the inside of homes can look dreary. Here are some tips to minimize the impact of duller days.

  • Clean your windows and screens on both sides before listing

  • Make sure all blinds, and window coverings are open as wide as they can go

  • Show your home earlier in the day if possible

  • Consider outdoor landscape lighting, patio lighting or solar pathway lighting

5. Give Sweater Weather Vibes

Keep your home feeling cozy from the outside in. Incorporate fall décor around your home’s exterior – it can be as simple as a wreath on the front door to a fully staged fall patio session, complete with chunky knit blankets and all! Inside, consider highlighting your fireplace if you have one, minimize clutter and placing a throw on the couch. Make your home feel welcoming and buyers may just want to stay.

6. Festive Frights Not Always a Delight

If you’re selling your home during Halloween season, unless you’re selling to the Addams Family, you might want to nix the spooky décor. If you want to decorate, use pumpkins or décor that can be easily stored away during showings. Just be sure the festive spirit doesn’t dampen the buying spirit of those viewing your home.

Fall is the time for new beginnings. Follow these tips to help get your home sold and hopefully before you know it, you will be starting yours.

© 2022RE/MAX, LLC. Each RE/MAX Office Independently Owned and Operated 22_304825

RE/MAX Canada Launches Sale Away Contest - RE/MAX Canada

You Could Win $10,000 Toward a Vacation Rental; Contest Runs May 18 Until July 20, 2022

Have you been thinking about selling your home? Moving on to greener pastures? In addition to the Unfair Advantage you already get by working with a RE/MAX Agent, including access to cutting-edge resources and a vast team of experienced agents, RE/MAX® Canada is giving you another chance to win when selling your home, with the Sale Away Contest.

The contest opens May 18, 2022 and runs until July 20, 2022. If you’ve entered into a fully executed listing agreement with a RE/MAX Agent from Mar 1, 2022 onwards to July 20, 2022, you can enter for a chance to win. Visit remax.ca/saleaway to enter and for Official Rules.

Three winners will be selected to win a $10,000 Airbnb gift card to be used toward a vacation rental. There will be three draw dates with one (1) winner drawn on each date: June 8, 2022, June 29, 2022 and July 21, 2022.

*Entering into a listing agreement with RE/MAX agent is required for entry. Purchase or payment will not increase your chance of winning. Void where prohibited or restricted by law. Subject to Official Rules. Legal Canadian residents, excluding Quebec. 21+. Other eligibility restrictions apply. Contest Period begins 5/18/22 at 12:00 am EDT and ends 7/20/22 at 11:59 pm EDT. Sponsored by RE/MAX Promotions, Inc.

Each office independently owned and operated.

Canada Housing Market Outlook to 2027

  • Pragmatic policy across interest rates, immigration and taxation could deliver a stable, albeit expensive Canada housing market through to 2027

  • RE/MAX Canada launches chapter one of Unlocking the Future: 5 Year Outlook Report in partnership with CIBC and The Conference Board of Canada

  • This series of reports, done in collaboration with relevant area experts, will be issued through 2022 and will leverage specific “what if” scenarios related to economic policy decisions, climate change, the future of on-premise work and technology, and how they may impact the housing market in Canada

The Canada housing market reflects more than just a commodity or an investment that is measured month-over-month or quarter-over-quarter. And while it is a key economic indicator, the vast majority of existing and prospective homeowners see their home as a long-term financial, as well as emotional, investment. Unlocking the Future, Chapter One examines economic scenarios across interest ratesimmigration policy and taxation, in cooperation with Benjamin Tal, Deputy Chief Economist and Jamie Golombek, Managing Director, Tax and Estate Planning, CIBC; and The Conference Board of Canada. This chapter concludes, with caveats, that despite economic headwinds, the housing market in Canada is more stable than many perceive and is likely to sustain stability over the next five years. Though housing prices in Canada will likely remain expensive, price growth may be less extreme than that experienced in the last three years.

VIEW AND DOWNLOAD UNLOCKING THE FUTURE: CHAPTER 1

This report, as well as the ones that follow, tries to provide something that will help Canadians take a longer-term view of their investments by taking into consideration possible hypothetical outcomes based on historical learnings, and current and near-future market conditions. The intention is to have Canadians come into this idea “sandbox,” but keep in mind RE/MAX Canada and its collaborators on this report are not trying to predict the future, but rather just model some different versions of it for the collective benefit of Canadians.

“Extraordinary housing activity over the past two years has caused a great deal of uncertainty and anxiety among many Canadian homebuyers, sellers, and those who aspire to enter the market. To help ease some of the worries and concerns that come with today’s social and economic volatility, we wanted to give Canadians more long-term context and clarity ─ to be more informed ─ about their most precious possession and one of their most valued assets,” says Christopher Alexander, President, RE/MAX Canada.

Alexander adds, “as a scenario-based exercise, chapter one also looks at the scenarios that could potentially ‘upset the applecart’ should the Bank of Canada overreach in fighting inflation, politicians fail to tie immigration policy to our labour market needs, or our governments seek to rein-in deficits with aggressive new taxes. While we anticipate it could be a stable five years ahead, it’s by no means assured.”

Key takeaways:

  • Interest rate increases at a reasonable schedule of four times a year would create a stable and more relaxed housing market over the next five years.

  • Current immigration policy is focused significantly on accepting new Canadians on the basis of their economic and social capital characteristics (i.e., education, French/English language skills, and previous Canadian work or study experience). However, the policy could be more clearly linked with national labour market demands, especially relating to construction trades, potentially addressing housing supply issues driven by skill shortages.

  • While the deployment of taxes such as the foreign buyer’s tax has been front and centre over the last few years as a tactic to calm Canada housing market prices, removing the exemption on capital gains for principal residences could have a greater impact on market disruption.

According to a Leger survey commissioned by RE/MAX Canada as part of the report:

  • Over the next five years, Canadians said taxation (50 per cent), rising interest rates (46 per cent), and the possibility of an economic recession (42 per cent) rank as their top three worries when it comes to buying a home.

  • Thinking ahead five years, 37 per cent of Canadians say their preferred community would be suburban, while 30 per cent want to live in an urban environment, and 27 per cent say rural.

  • 61 per cent of Canadians agree that real estate is the best long-term investment they could make (which they don’t see changing over the next five-years), however, rising property-related taxes (64 per cent), rising interest rates (58 per cent) and a possible capital gains tax (55 per cent) are factors that would cause barriers or concerns when it comes to buying a home in that time frame.

*Source: Lydia McNutt Public Relations and Content Manager - remax.ca

Greater Toronto Housing Market: 25-Year Comparison

Exceptional gains in Greater Toronto housing market fuelled by rapid population growth, land scarcity and low interest rates

Average price increased more than 450 per cent, while unit sales have doubled since 1996 

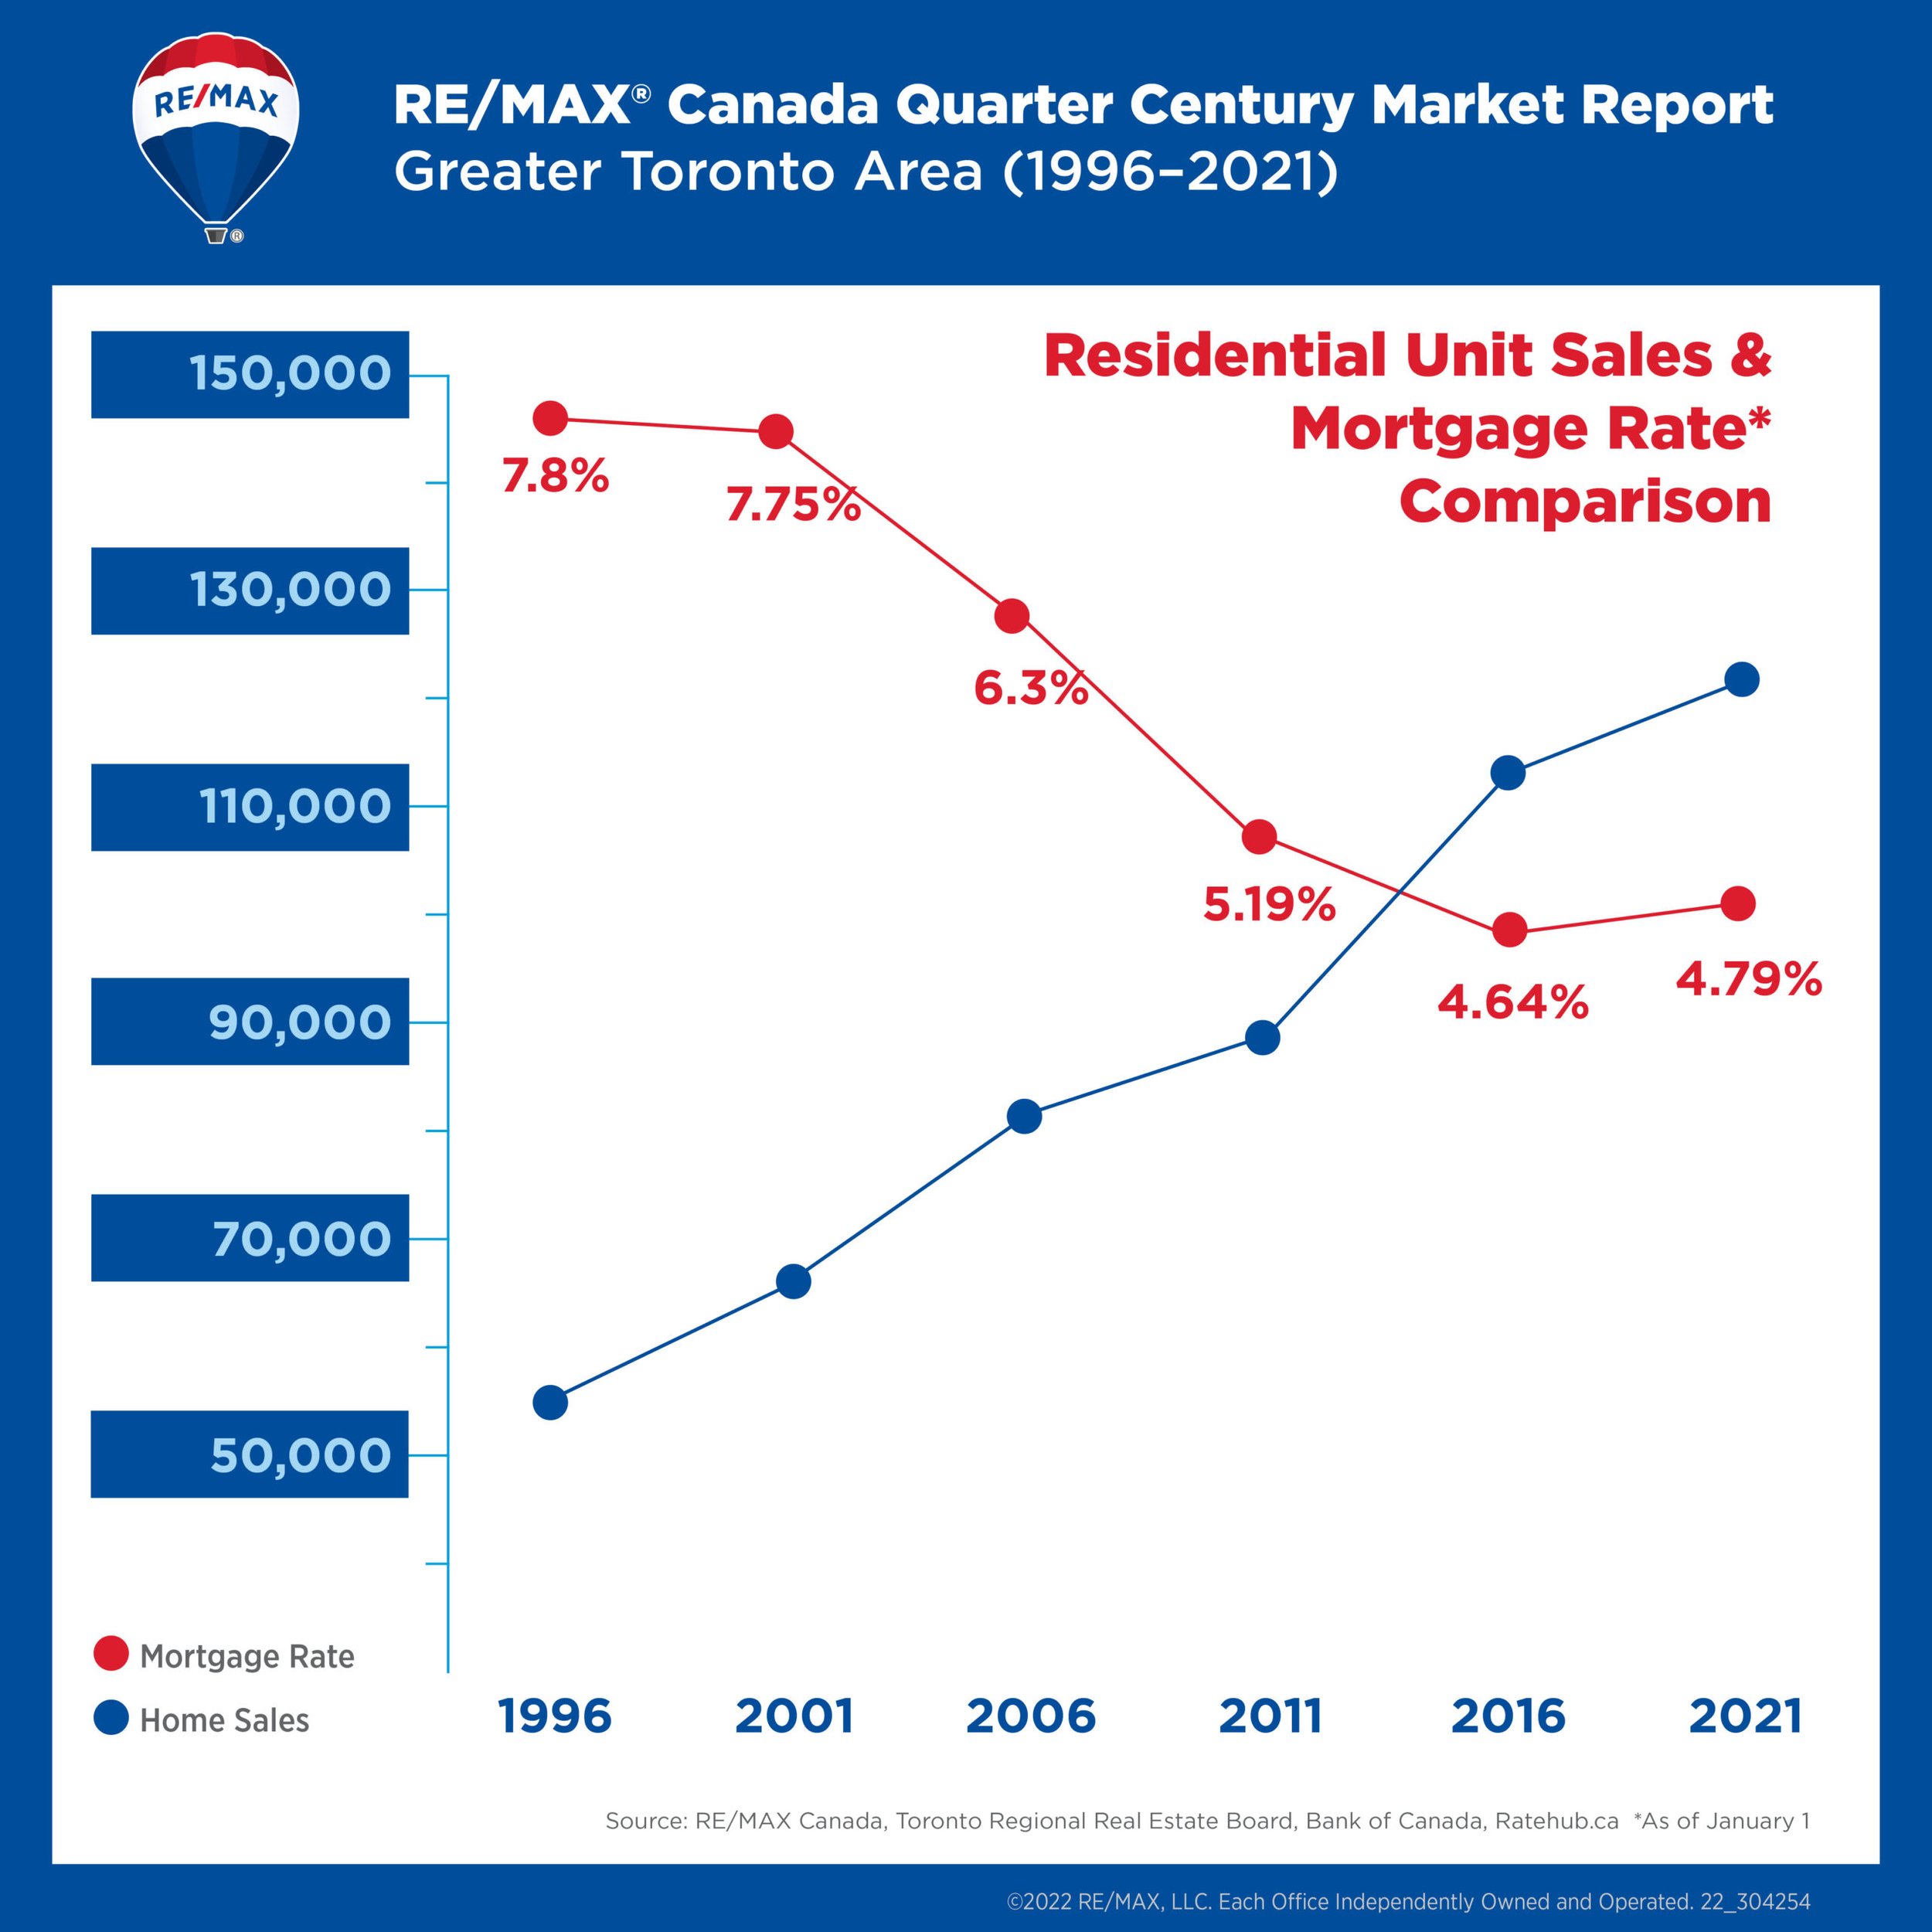
Residential unit sales in the Greater Toronto housing market have doubled and average price has increased more than 450 per cent since 1996, as strong demand and limited supply continue to drive rapid price escalation throughout the 416 and 905 area codes, according to a new report released by RE/MAX Canada.

Between 1996 and 2021, more than two million homes sold in the GTA, representing a dollar volume in excess of $1.1 trillion. Average price has soared over the 25-year period, rising close to 453 per cent, from $198,150 in 1996 to $1,095,475 in 2021, at a compound annual growth rate of 7.08 per cent. Statistics Canada reports the Toronto CMA reached 6,202,225 in 2021, an increase of 45 per cent over the 1996 Census figure of 4,263,759.

“Performance of the Greater Toronto housing market over the 25-year period has been nothing short of remarkable,” says Christopher Alexander, President, RE/MAX Canada. This is especially so, when considering this time period was characterized by the tech meltdown of 2000, 9/11, SARS, the Great Recession of 2008, Ontario’s Fair Housing Plan and the on-going pandemic. “Many have raised concerns about the future of housing, given population growth and land scarcity within the Greater Toronto Area.”

The RE/MAX Canada Quarter Century Market Report analyzed home-buying activity in the nine Toronto Regional Real Estate Board (TRREB) districts that comprise the GTA – Toronto East, Toronto West, Toronto Central, Durham, Halton, Peel and York Regions, and Simcoe and Dufferin Counties – and found land availability, especially in the city’s core and bedroom communities, has waned. This, as migration, low interest rates, and affordability continue to play a critical role in the growth of the GTA. Triple-digit increases in sales were noted in Toronto Central, Halton Region, York Region, Simcoe County and Dufferin County over the past 25 years, while average sale prices reached new heights across the greater Toronto housing market, with percentage increases climbing between 1996 and 2021, from a low of 301 per cent in Toronto Central, to a high of 874 per cent in York Region.

New construction has been a significant factor in the sales gains in Halton, Durham, Peel and York Regions, the latter two of which are approaching build-out. Over the years, the 905 communities offered affordable alternatives to those looking to purchase freehold properties. Starter homes on smaller lots attracted many first-time buyers in locations to the west, north and east of the 416 area code, supported by the new and proposed expansion of GO train service and another 400-series highway servicing the GTA’s northeast/west corridor. The movement brought new life into older communities, forever changing the make-up of cities such as Milton, Whitby, Clarington, East Gwillimbury and Innisfil.

“If you build it, they will come, and they sure did,” says Alexander. “Bolstered by historically low interest rates, a strong economy, grit and determination, buyers both young and old have moved to the city’s bedroom communities.”

With limited land to build on in the 905, emphasis is now shifting from freehold to high-density homes: condominiums in land-locked Mississauga now represent one in every two sales, while new condominium developments are planned and proposed for Brampton, York Region (transit-oriented communities) and Pickering’s City Centre.

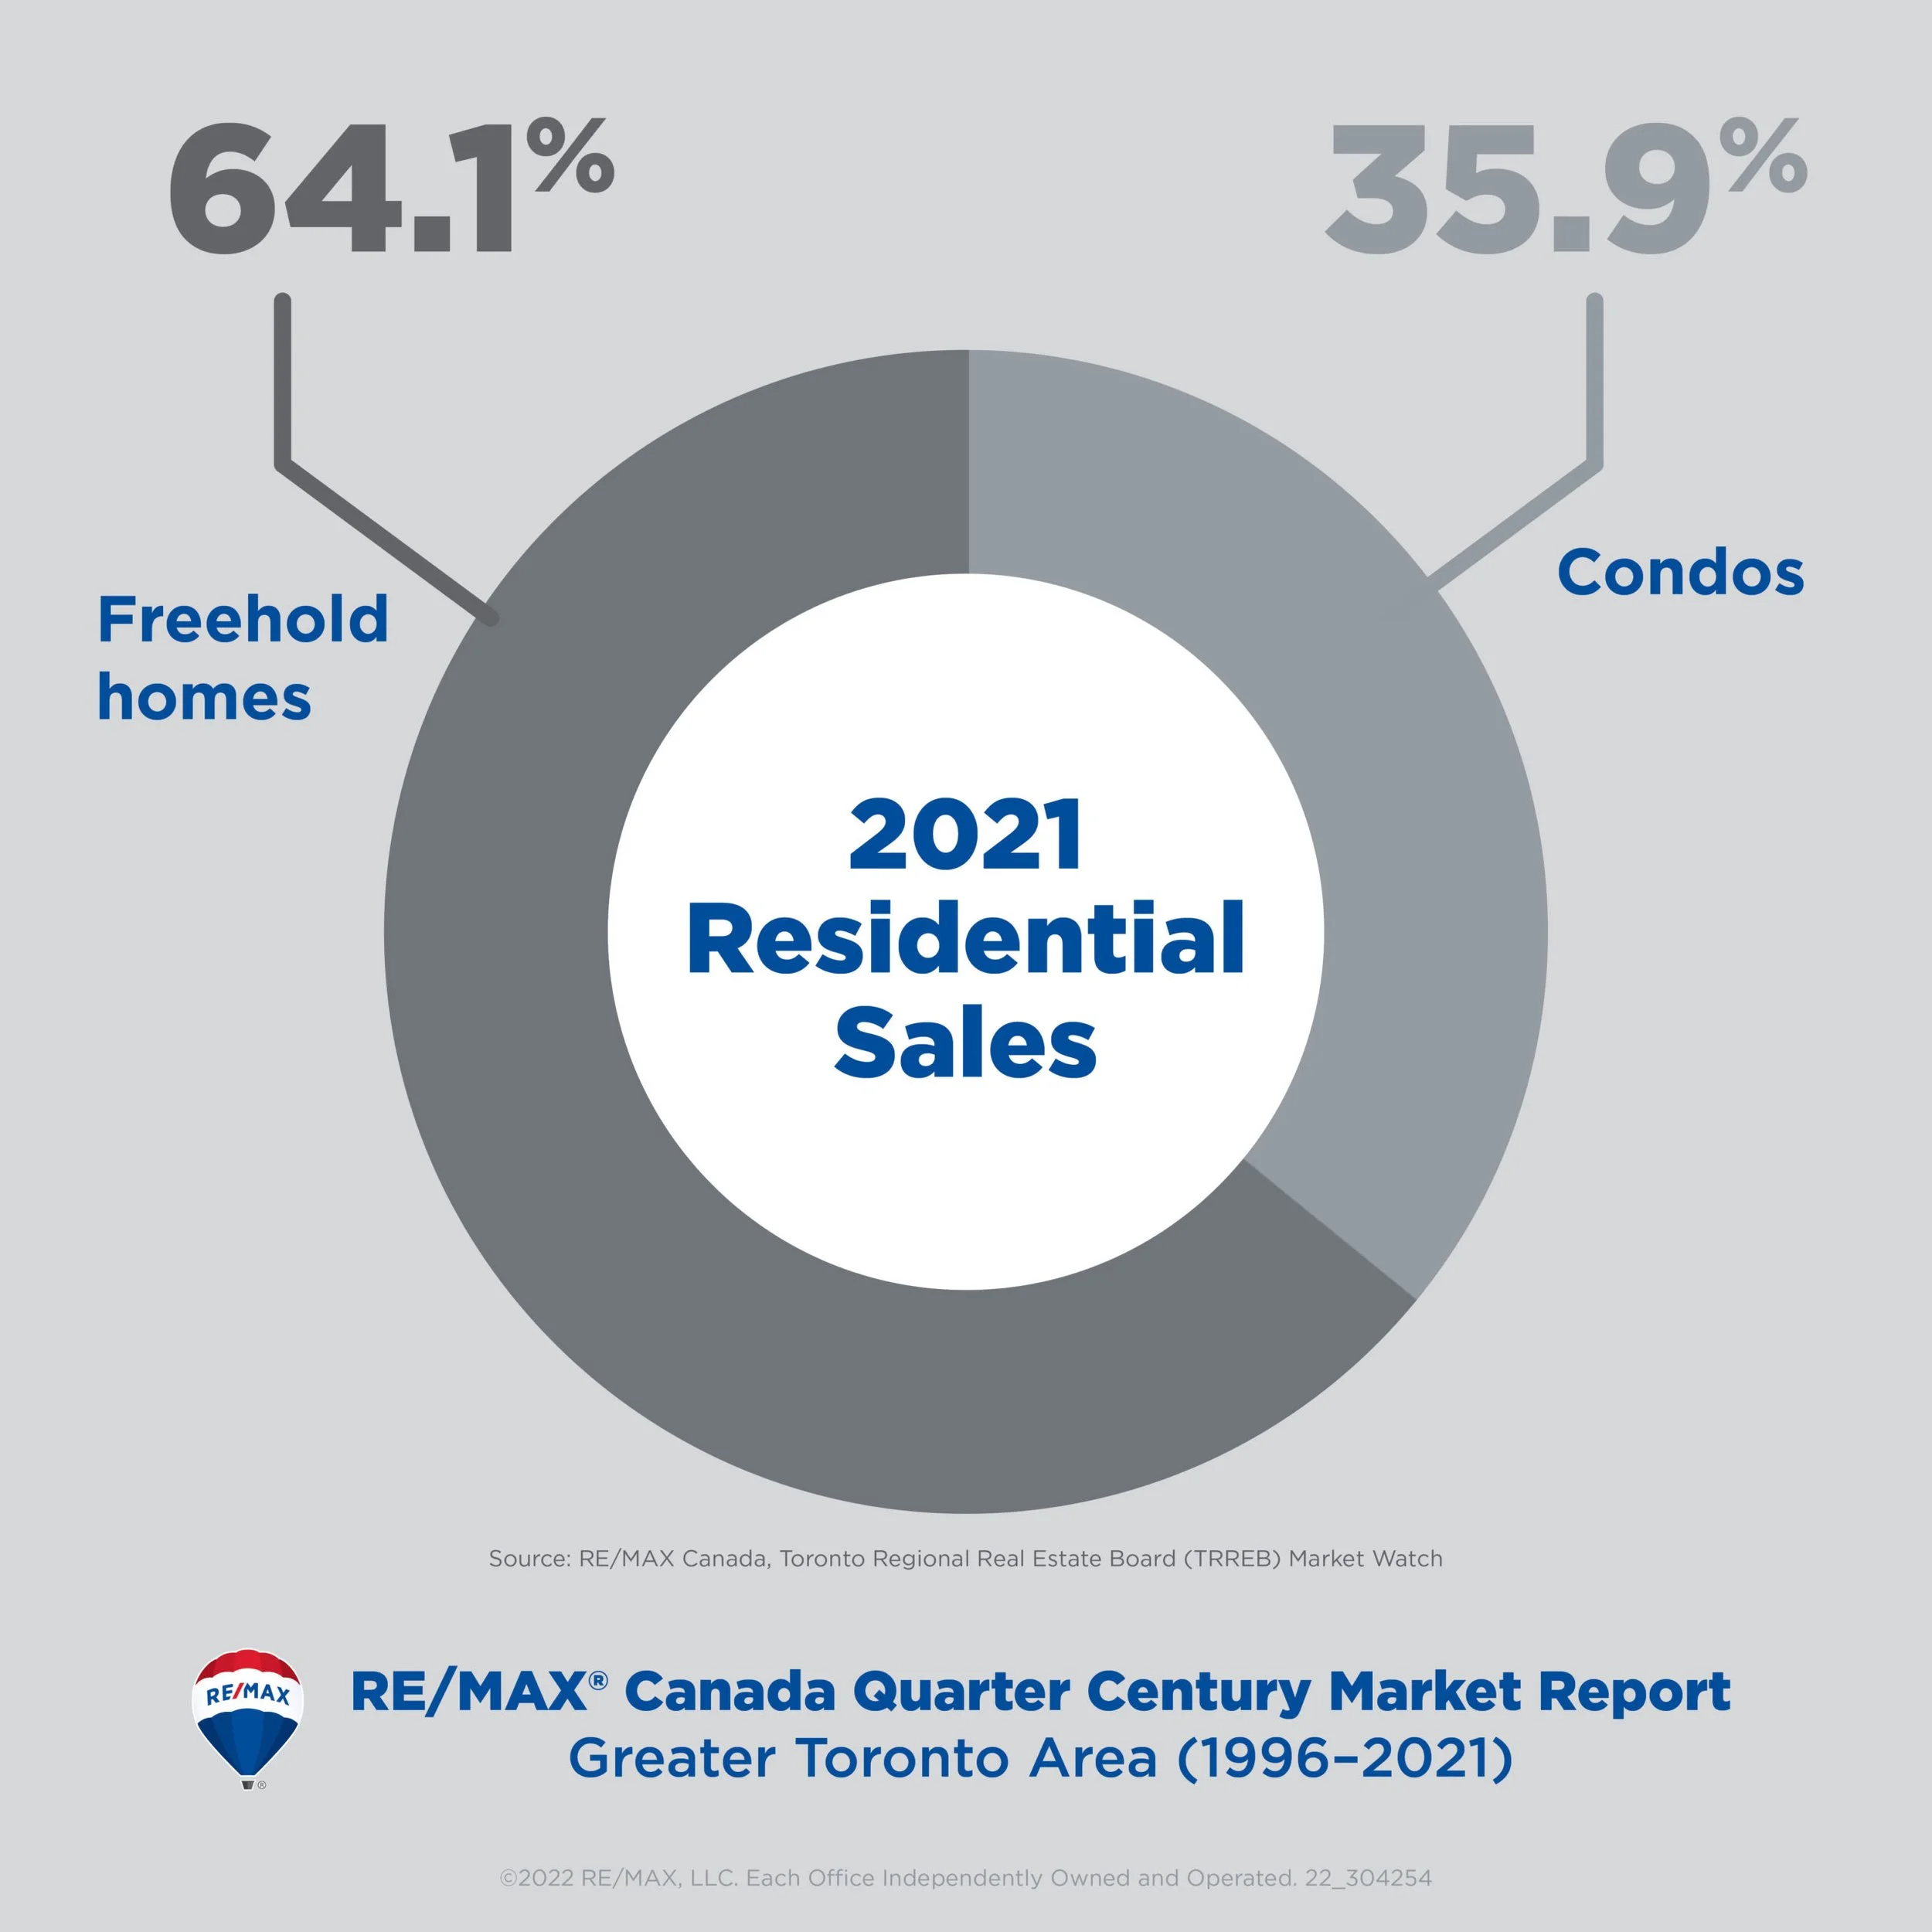
Over the past quarter century, vertical growth has played a significant role in rising sales figures within the 416, with condominium apartments and townhomes now exceeding freehold sales in Central Toronto, accounting for 76 per cent of sales, according to TRREB data. With many of the vacant lots, parking lots and smaller commercial/industrial properties bought up, builders and developers are now looking at existing buildings and weighing the pros and cons of demolition. Some have gutted and redeveloped existing structures in prime locations, such as the Imperial Oil building on St. Clair (now the Imperial Plaza Condominiums), the old Four Seasons Hotel, and the Sutton Place Hotel (now a 727-unit residential condominium known as The Britt).

DOWNLOAD THE REPORT

*Source: Lydia McNutt, Public Relations & Content Manager | RE/MAX Canada

https://blog.remax.ca/greater-toronto-housing-market-report/

Canadian Real Estate Prices Expected to Rise 9.2% in 2022: RE/MAX

Confidence continues in Canadian real estate market, with the inter-provincial relocation trend likely to remain strong in 2022

Migration between provinces expected to continue in 2022, potentially impacting local Canadian real estate conditions, according to 53 per cent of RE/MAX brokers (20 out of 38)

  • 49 per cent of Canadians believe the housing market will remain steady in 2022 and view real estate as one of the best investment options over the next year

  • Some of the highest outlooks are anticipated for Atlantic Canada, with Moncton and Halifax projecting average residential sales prices to increase by 20 per cent and 16 per cent respectively in 2022

  • 97 per cent of regions (37 out of 38) surveyed are likely to remain seller’s markets in 2022

Toronto, ON and Kelowna, BC, December 1, 2021 – RE/MAX is anticipating steady price growth across the Canadian real estate market in 2022, with inter-provincial migration continuing to be a key driver of housing activity in many regions, based on surveys of RE/MAX brokers and agents, as reflected in the 2022 Canadian Housing Market Outlook Report. The ongoing housing supply shortage is likely to continue, putting upward pressure on prices. As a result of these factors, RE/MAX Canada estimates a 9.2-per-cent increase in average residential sales prices across the country*.

DOWNLOAD THE FULL REPORT

.

“Based on feedback from our brokers and agents, the inter-provincial relocation trend that we began to see in the summer of 2020 still remains very strong and is expected to continue into 2022,” says Christopher Alexander, President, RE/MAX Canada. “Less-dense cities and neighbourhoods offer buyers the prospect of greater affordability, along with liveability factors such as more space. In order for these regions to retain these appealing qualities and their relative market balance, housing supply needs to be added. Without more homes and in the face of rising demand, there’s potential for conditions in these regions to shift further.”

Despite the global pandemic, many Canadians still feel confident in the real estate market. According to a Leger survey conducted on behalf of RE/MAX Canada, 49 per cent of respondents believe Canadian real estate will remain one of their best investment options in 2022 (59 per cent of homeowners vs. 34 per cent non-homeowners which included renters, those not looking buy, and those currently looking to purchase). Additionally, 49 per cent of respondents are confident the Canadian real estate market will remain steady next year.

“Canadians recognize the value and investment potential in their homes. However, market challenges such as rising prices and limited supply have impacted local markets from coast-to-coast, causing angst this past year among those looking to get into the market and those hoping to move up in it,” says Elton Ash, Executive Vice President, RE/MAX Canada. “Despite this, it’s encouraging to see that many are feeling confident in the housing market in 2022 and view Canadian real estate as a solid investment.”

DOWNLOAD THE DATA TABLE

2022 Regional Canadian Real Estate Insights

RE/MAX brokers and agents in Canada were asked to provide an analysis of their local market in 2021 and share their estimated outlook for 2022. Based on their insights, 97 per cent of Canadian real estate markets are expected to favour sellers, impacted by limited housing supply and high demand.

WESTERN CANADA

The Calgary and Edmonton markets shifted from balanced conditions in 2020 to seller’s markets in 2021, which brokers and agents in the region expect to continue into 2022. This is attributed to heightened demand prompted by the inter-provincial migration trend that took place throughout 2021, which saw many homebuyers from Ontario and British Columbia driving demand high, while supply remained low.

In addition to an increase in out-of-province buyers flocking to Edmonton, the region has also welcomed investors who found themselves priced out of other markets. RBC’s provincial outlook for Alberta puts this province ahead of all others in terms of economic growth in 2022, which should bode well for homebuyers and investors alike 2022.

Regions such as Victoria, Nanaimo, Regina and Kelowna also experienced an influx of buyers in search of larger properties and greater affordability, which is likely to continue pushing demand and prices up in 2022. This trend has notably increased demand for single-family detached homes and in some regions, condos as well, which may continue in 2022.

Despite some buyers choosing to move away from urban centres such as Vancouver/Greater Vancouver in favour of suburban areas within British Columbia, or leaving the province entirely, Vancouver/Greater Vancouver has remained a quality place to live. The region continues to draw interest from Canadian and international buyers, a trend that is likely to grow next year, in tandem with rising immigration. Vancouver/Greater Vancouver is expected to remain a seller’s market in 2022, providing inventory stays tight and current demand continues, according to a RE/MAX broker in Greater Vancouver Area.

Winnipeg is anticipated to continue to be a seller’s market in 2022. Young couples enjoying the freedom to work from home have been driving much of the demand in the region, especially for one- and two-story detached homes. The appeal of Winnipeg has had less to do with affordability, and more with lifestyle shifts such as hybrid working environments.

ONTARIO

According to the RE/MAX broker network in Ontario, market activity across the province is anticipated to remain steady in 2022, with continued average price growth, although at widely varying degrees. RE/MAX brokers anticipate average sale price increases in smaller markets such as North Bay (four per cent); Sudbury (five per cent); Thunder Bay (10 per cent); Collingwood/Georgian Bay (10 per cent); and Muskoka (20 per cent), where the move-over trend has remained strong. Meanwhile, in larger markets within the province, there’s a possibility that more immigration could weigh on supply levels and prices, including Ottawa (five per cent); Durham (seven per cent); Brampton (eight per cent); Toronto (10 per cent); Mississauga (14 per cent).

When it comes to price appreciation year-over-year, there are a few regions that stood out in 2021 for their exponential increases across all property types, including Brampton, which rose from $869,107 in 2020 to $1,085,417 in 2021 (25 per cent); Durham from $706,818 in 2020 to $914,48 in 2021 (29 per cent); and London from $487,500 in 2020 to $633,700 in 2021 (30 per cent). In comparison, Toronto experienced a modest seven-per-cent increase year-over-year ($986,085 in 2020 to $1,054,922 in 2021)

ATLANTIC CANADA

All of Atlantic Canada’s regions analyzed are currently seller’s markets, with potential for average sale prices to increase between five to 20 per cent in 2022, according to RE/MAX brokers and agents. Larger urban centres including Moncton, Fredericton, Saint John, Halifax, Charlottetown and St. John’s have all experienced an influx of out-of-province buyers, especially from Ontario, moving to the region in search of greater affordability and liveability.

Due to this spike in demand, much of the region has experienced increasing competition, especially among single-family detached homes and condos in some cities. There’s a possibility that this may further be amplified as immigration continues to grow in the region.

According to RE/MAX brokers and agents in the region, new construction is anticipated to remain strong into 2022, although construction activity may be dampened by ongoing supply shortages and delays in permits related to the pandemic backlog.

Seller’s market conditions are expected to prevail across the region in 2022, with the exception of Charlottetown and Southern Nova Scotia, which may return more to a balanced state as activity gradually begins to decrease.

These factors have led to some of the highest price outlooks in the country, with Halifax and Moncton projecting estimated average residential sales price to increase by 16, and 20 per cent respectively.

Additional findings from the 2022 Canadian Housing Market Outlook Report

  • Two-in-five Canadians trust their agent to advise them during the current real estate landscape (43 per cent)

  • 23 per cent of Canadians now have a greater desire to build their own home or buy pre-construction

  • 26 per cent of Canadians have the desire to purchase a home while mortgage rates remain low

  • 62 per cent of Canadians currently own a home. This is higher among those ages 35+ (70 per cent) compared with Millennials, ages 18-34 (42 per cent)

  • The majority of Canadians (72 per cent) said rising home prices did not impact their purchasing decisions in 2021.

About the 2022 Housing Market Outlook Report

The 2022 RE/MAX Housing Market Outlook Report includes data and insights from RE/MAX brokerages. RE/MAX brokers and agents are surveyed on market activity and local developments. Regional summaries with additional broker insights can be found at REMAX.ca. The overall outlook is based on the average of all regions surveyed, weighted by the number of transaction in each region.

*2020 average residential sale price numbers were full-year, 2021 were from January 2021 – October 31, 2022.

About Leger
Leger is the largest Canadian-owned full-service market research firm. An online survey of 1,554 Canadians was completed between October 29-31, 2021 using Leger’s online panel. Leger’s online panel has approximately 400,000 members nationally and has a retention rate of 90 per cent. A probability sample of the same size would yield a margin of error of +/- 2.5 per cent, 19 times out of 20.

About the RE/MAX Network
As one of the leading global real estate franchisors, RE/MAX, LLC is a subsidiary of RE/MAX Holdings (NYSE: RMAX) with more than 140,000 agents in over 8,600 offices across more than 110 countries and territories. Nobody in the world sells more real estate than RE/MAX, as measured by residential transaction sides. RE/MAX was founded in 1973 by Dave and Gail Liniger, with an innovative, entrepreneurial culture affording its agents and franchisees the flexibility to operate their businesses with great independence. RE/MAX agents have lived, worked and served in their local communities for decades, raising millions of dollars every year for Children’s Miracle Network Hospitals® and other charities. To learn more about RE/MAX, to search home listings or find an agent in your community, please visit remax.ca. For the latest news from RE/MAX Canada, please visit blog.remax.ca.

Forward looking statements
This report includes “forward-looking statements” within the meaning of the “safe harbour” provisions of the United States Private Securities Litigation Reform Act of 1995. Forward-looking statements may be identified by the use of words such as “believe,” “intend,” “expect,” “estimate,” “plan,” “outlook,” “project,” and other similar words and expressions that predict or indicate future events or trends that are not statements of historical matters. These forward-looking statements include statements regarding housing market conditions and the Company’s results of operations, performance and growth. Forward-looking statements should not be read as guarantees of future performance or results. Forward-looking statements are based on information available at the time those statements are made and/or management’s good faith belief as of that time with respect to future events and are subject to risks and uncertainties that could cause actual performance or results to differ materially from those expressed in or suggested by the forward-looking statements. These risks and uncertainties include (1) the global COVID-19 pandemic, which has impacted the Company and continues to pose significant and widespread risks to the Company’s business, the Company’s ability to successfully close the anticipated reacquisition and to integrate the reacquired regions into its business, (3) changes in the real estate market or interest rates and availability of financing, (4) changes in business and economic activity in general, (5) the Company’s ability to attract and retain quality franchisees, (6) the Company’s franchisees’ ability to recruit and retain real estate agents and mortgage loan originators, (7) changes in laws and regulations, (8) the Company’s ability to enhance, market, and protect the RE/MAX and Motto Mortgage brands, (9) the Company’s ability to implement its technology initiatives, and (10) fluctuations in foreign currency exchange rates, and those risks and uncertainties described in the sections entitled “Risk Factors” and “Management’s Discussion and Analysis of Financial Condition and Results of Operations” in the most recent Annual Report on Form 10-K and Quarterly Reports on Form 10-Q filed with the Securities and Exchange Commission (“SEC”) and similar disclosures in subsequent periodic and current reports filed with the SEC, which are available on the investor relations page of the Company’s website at www.remax.com and on the SEC website at www.sec.gov. Readers are cautioned not to place undue reliance on forward-looking statements, which speak only as of the date on which they are made. Except as required by law, the Company does not intend, and undertakes no duty, to update this information to reflect future events or circumstances.

Source: Lydia McNutt Public Relations & Content Manager | RE/MAX Canada [remax.ca]

Greater Toronto Real Estate Market Report (2021): RE/MAX Canada

Toronto-real-estate-price-heat-map-2021_featured-image.jpeg

Greater Toronto real estate seen staggering growth in single-detached sales and average price, little sign of slowing despite shortage of available listings

  • Year-to-date sales in York Region rise close to 110 per cent while Peel and Central Toronto almost double over 2020 levels,

  • Nearly half of 60 TRREB districts reporting year-over-year average price increases in excess of 25 per cent

A steady decline in the supply of single-detached housing in the Greater Toronto Area (GTA), coupled with mortgage rates hovering well-below three per cent, hastened demand from first-time homebuyers and galvanized the city’s move-up market in the first half of 2021, according to a new Greater Toronto real estate report released today by RE/MAX Canada.

The RE/MAX 2021 GTA Hot Pocket Communities Report examined trends and developments in 60 Toronto Regional Real Estate Board (TRREB) districts, finding that inventory constraints propelled demand throughout the GTA and set the stage for unprecedented market performance. With 11,297 active listings, this was the lowest level for June in at least a decade and down 35 per cent from the 10-year average of 17,260, surpassing the previous low of 12,327 reported in June of 2016. As a result, the average price for single-detached homes soared, with values in almost 97 per cent of TRREB communities well-ahead of year-ago levels, with nearly half reporting an increase of 25 per cent or more compared to the same period in 2020. The top 10 performers in 2021 in terms of year-over-year price appreciation ranged from 34.2 per cent in Milton (Halton Region), to a high of 46.4 per cent in Durham Region’s Uxbridge this year.


DOWNLOAD THIS TABLE

.

Average price of detached homes in the GTA, by neighbourhood


Unit sales of detached homes in the GTA, by neighbourhood

DOWNLOAD HEAT MAPS

.

Across the board, RE/MAX Canada found appreciation in detached housing values was accompanied by a significant upswing in sales volume between January and June of 2021. When compared to the same period last year, unit sales more than doubled in York Region (109.6 per cent), while Peel and Central Toronto posted gains of 98.2 per cent and 96.7 per cent respectively. Sales increases across the GTA ranged from a low of 33.3 per cent in the East End’s Wexford-Maryvale, Clairlea-Birchmount, Kennedy Park, Ionview and Dorset Park (E04) community  to a high of 175 per cent in Dufferin Grove, Little Portugal, Trinity-Bellwoods, Palmerston-Little Italy, Niagara, University, Kensington-Chinatown, Bay St. Corridor, and Waterfront Communities (C01) in the Central Core.

“Halfway into 2021 and the Greater Toronto housing market continues to fire on all cylinders,” says Christopher Alexander, Senior Vice President of RE/MAX Canada. “Overall home sales topped 70,000 between January and June, the strongest first half in the history of the Toronto Regional Real Estate Board, while values smashed through record levels set in previous years. Without a serious influx of new listings to ease the upward pressure on pricing in the coming months, the market will likely continue on this upward trajectory.”

First-Time Buyers Flock to the 905

With interest rates at historic lows, first-time buyers are scrambling to get into the market before home ownership is beyond their financial reach. However, affordability challenges continue to be exacerbated by the supply crunch. Of the 60 TRREB communities examined in the RE/MAX 2021 Hot Pocket Communities Report, only six offered single-detached homes under the $1 million price point. This is compared to 18 communities during the same period in 2020, and 28 in 2019. All six markets were located in the 905-area code.

“More transit options and hybrid work schedules have made relocation to the city’s outlying areas even more attractive,” explains Alexander. “First-time buyers are feeling the squeeze but are still determined to become homeowners, with many happily travelling further afield to make it happen while working from home. The beneficiaries of the trend have been suburban communities in Durham, Peel, Dufferin County and the most northern part of York Region.”

New-home construction has intensified in outlying areas in recent years. This is especially so in the communities of Clarington, North Oshawa, East Gwillimbury, North Keswick (Georgina) and Caledon, where an abundance of new housing product has come to the market as resales and are quickly snapped up. East Gwillimbury home sales jumped 145.3 per cent to 444 units in the first half of the year, compared to 181 unit sales during the same period in 2020; Georgina climbed 90.4 per cent (710 vs. 373); Caledon, up 108.2 per cent, more than doubled (610 vs. 293); Oshawa increased 71.9 per cent (1,810 vs. 1,053) and Clarington rose 65.6 (1,139 vs. 688).

“While first-time buyers are grappling with supply and demand, existing homeowners have been reaping the rewards as equity gains have soared over the past two and half years,” says Alexander. “In recent months, many move-up buyers have taken advantage of lower interest rates and those equity gains to trade-up to larger homes or neighbourhoods closer to the downtown core – with not too much change to their monthly mortgage payments.”

Central Toronto Real Estate Sales Propelled by Move-Up Buyers

Homebuyers who are “trading up” are likely behind the push for housing in the 416 area code, driving sales in central areas such as Bathurst Manor and Clanton Park (C06), which are up 169.8 per cent (116 vs. 43) in the first six months of 2021, compared to year-ago levels. Meanwhile, sales in Lansing-Westgate, Newtonbrook West, Willowdale West and Westminster-Branson (C07) have climbed 120.3 per cent (271 vs. 123) during the same period. In the city’s east end, sales in Milliken, Agincourt North and South, and Malvern West (E07) jumped 171.4 per cent (190 vs. 70); Tam O’Shanter-Sullivan and L’Amoreaux Steele (E05) rose 107.4 per cent (197 vs. 95); and Malvern and Rouge (E11) increased by 101.3 per cent (153 vs. 76). To the west, Humberlea/Pelmo Park, Downsview-Roding-CFB, Glenfield-Jane Heights, York University Heights, Black Creek, Humbermede and Humber Summit (W05) appreciated 138.5 per cent (186 vs. 78), and Stonegate-Queensway (W07) rose 100 per cent (124 vs. 62).

Communities bordering on the 416-area code such as Vaughan and Markham in York Region, Pickering in Durham, and Mississauga and Brampton in Peel have also experienced a serious uptick in sales in the first half of the year, compared to one year ago, as they capture some of the movement back into the city.

“The most daunting aspect of the current housing surge is that this period may actually be the calm before the storm,” says Alexander. “With the worst of the pandemic hopefully in the rear-view mirror and recovery on its way, economic expansion is likely. The Bank of Canada is committed to holding interest rates at current historically low levels for at least another year. Immigration is expected to bring another 1.2 million permanent residents to the country over the next three years. With all this stimulus at play, comparisons have been made to the Roaring 1920s – let’s just hope that this script has a better ending.”

About the RE/MAX 2021 GTA Hot Pocket Communities Report

The 2021 GTA Hot Pocket Communities Report is based on data from the Toronto Regional Real Estate Board and information provided by RE/MAX brokerages. Local RE/MAX brokers were surveyed in July 2021 for their insights on market activity and local developments.
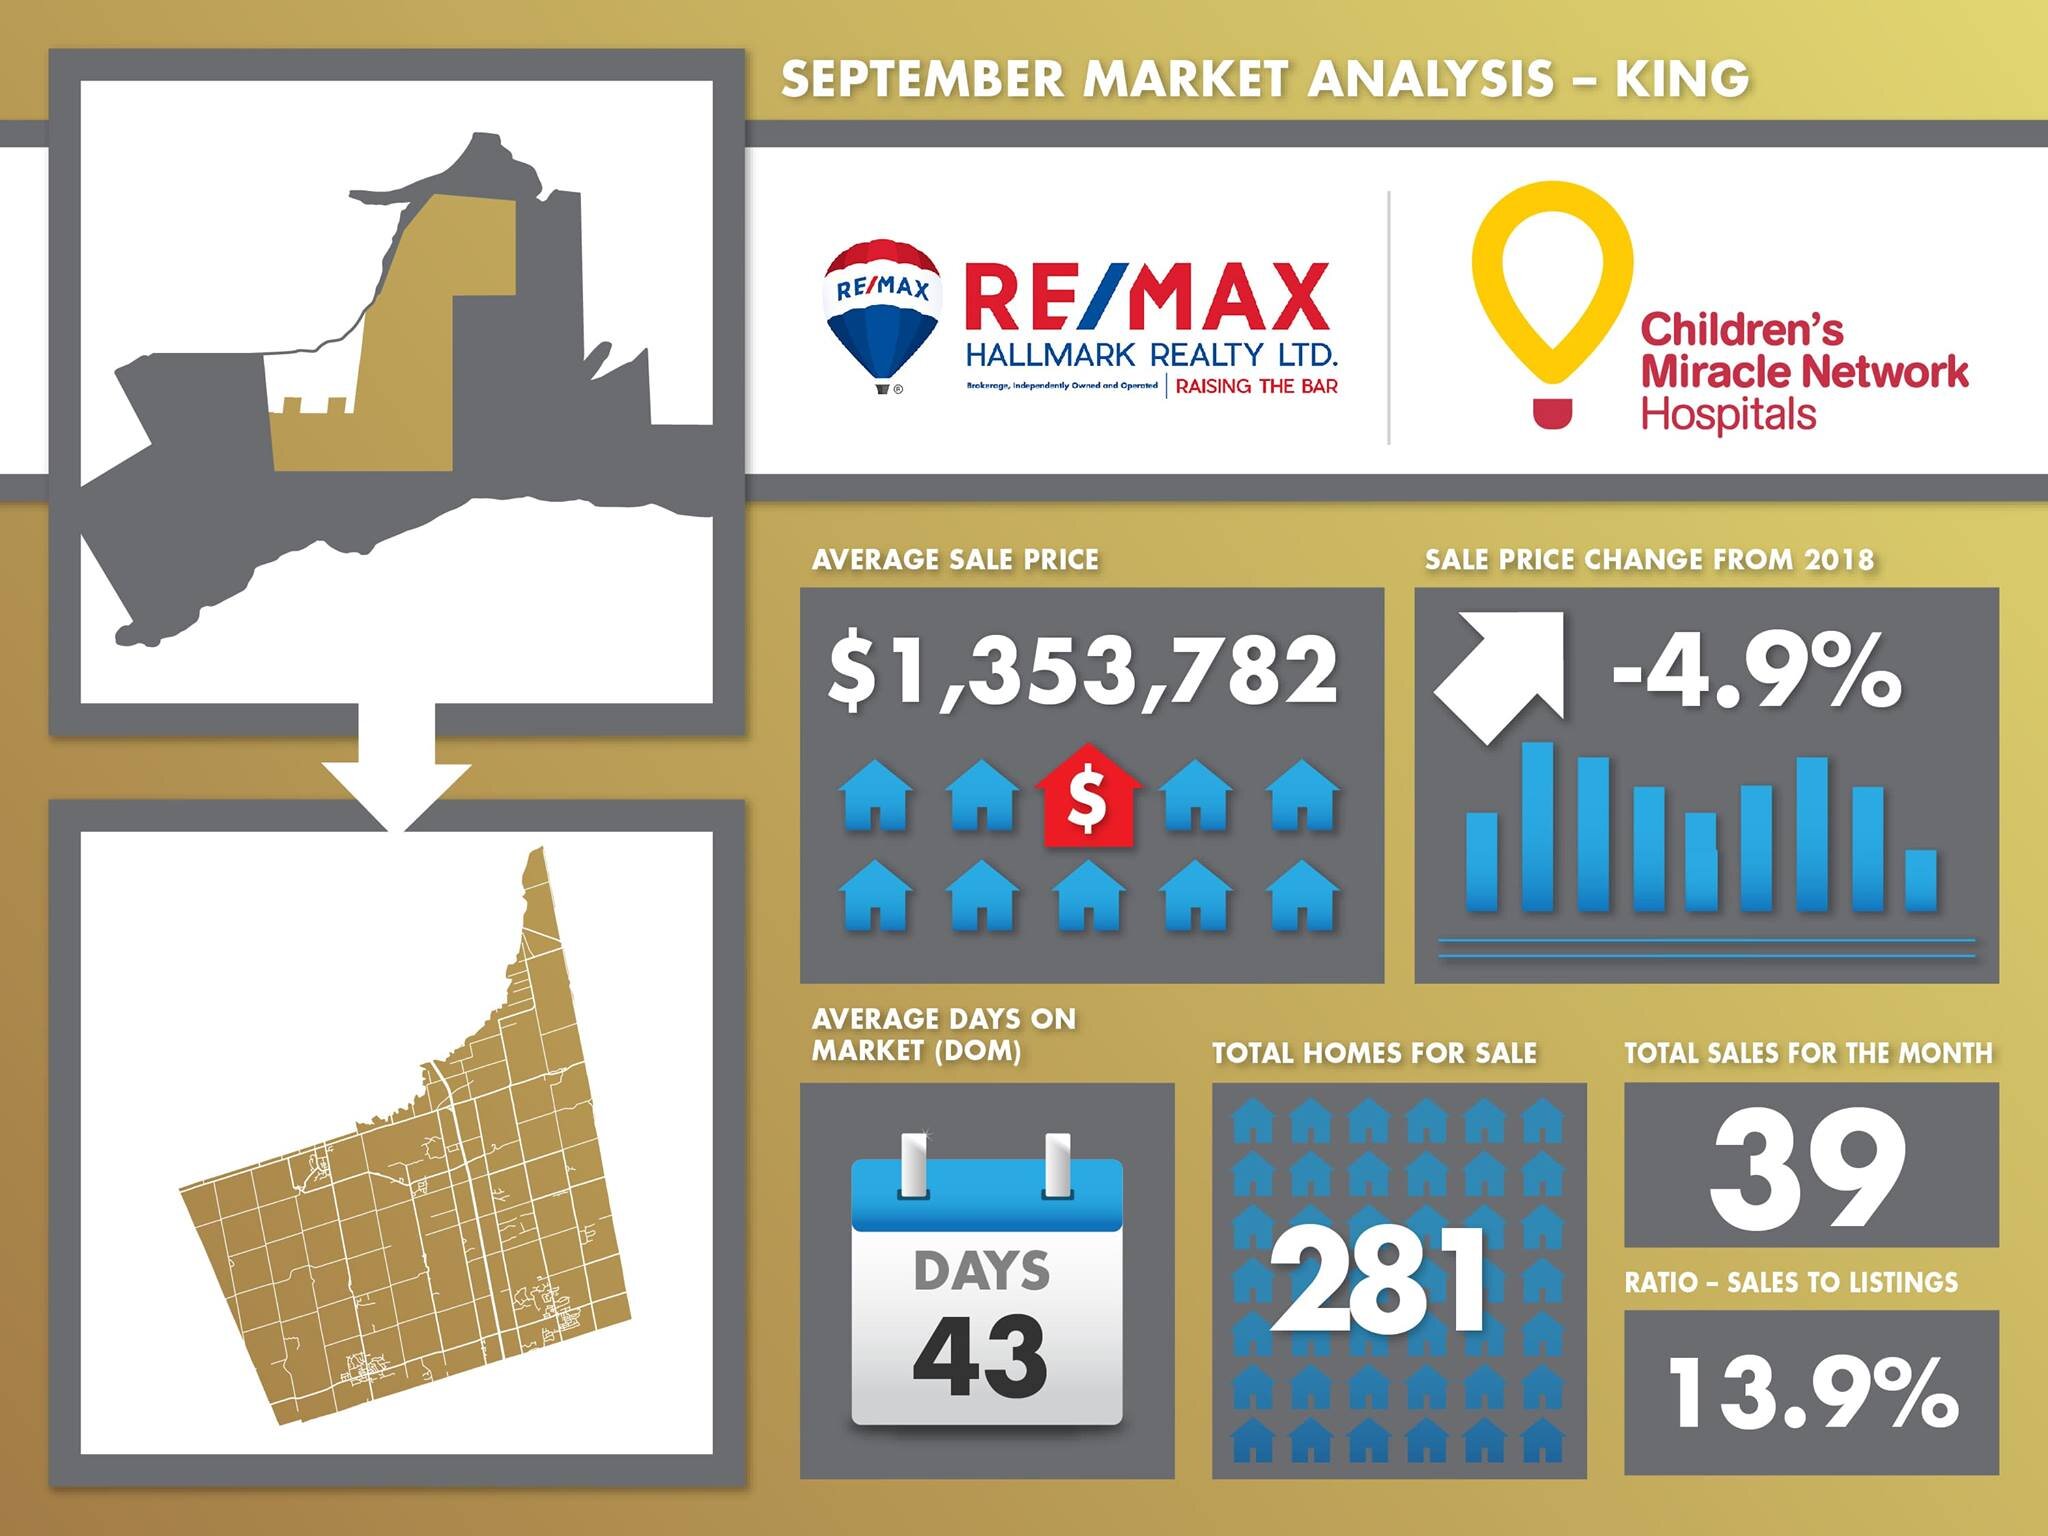
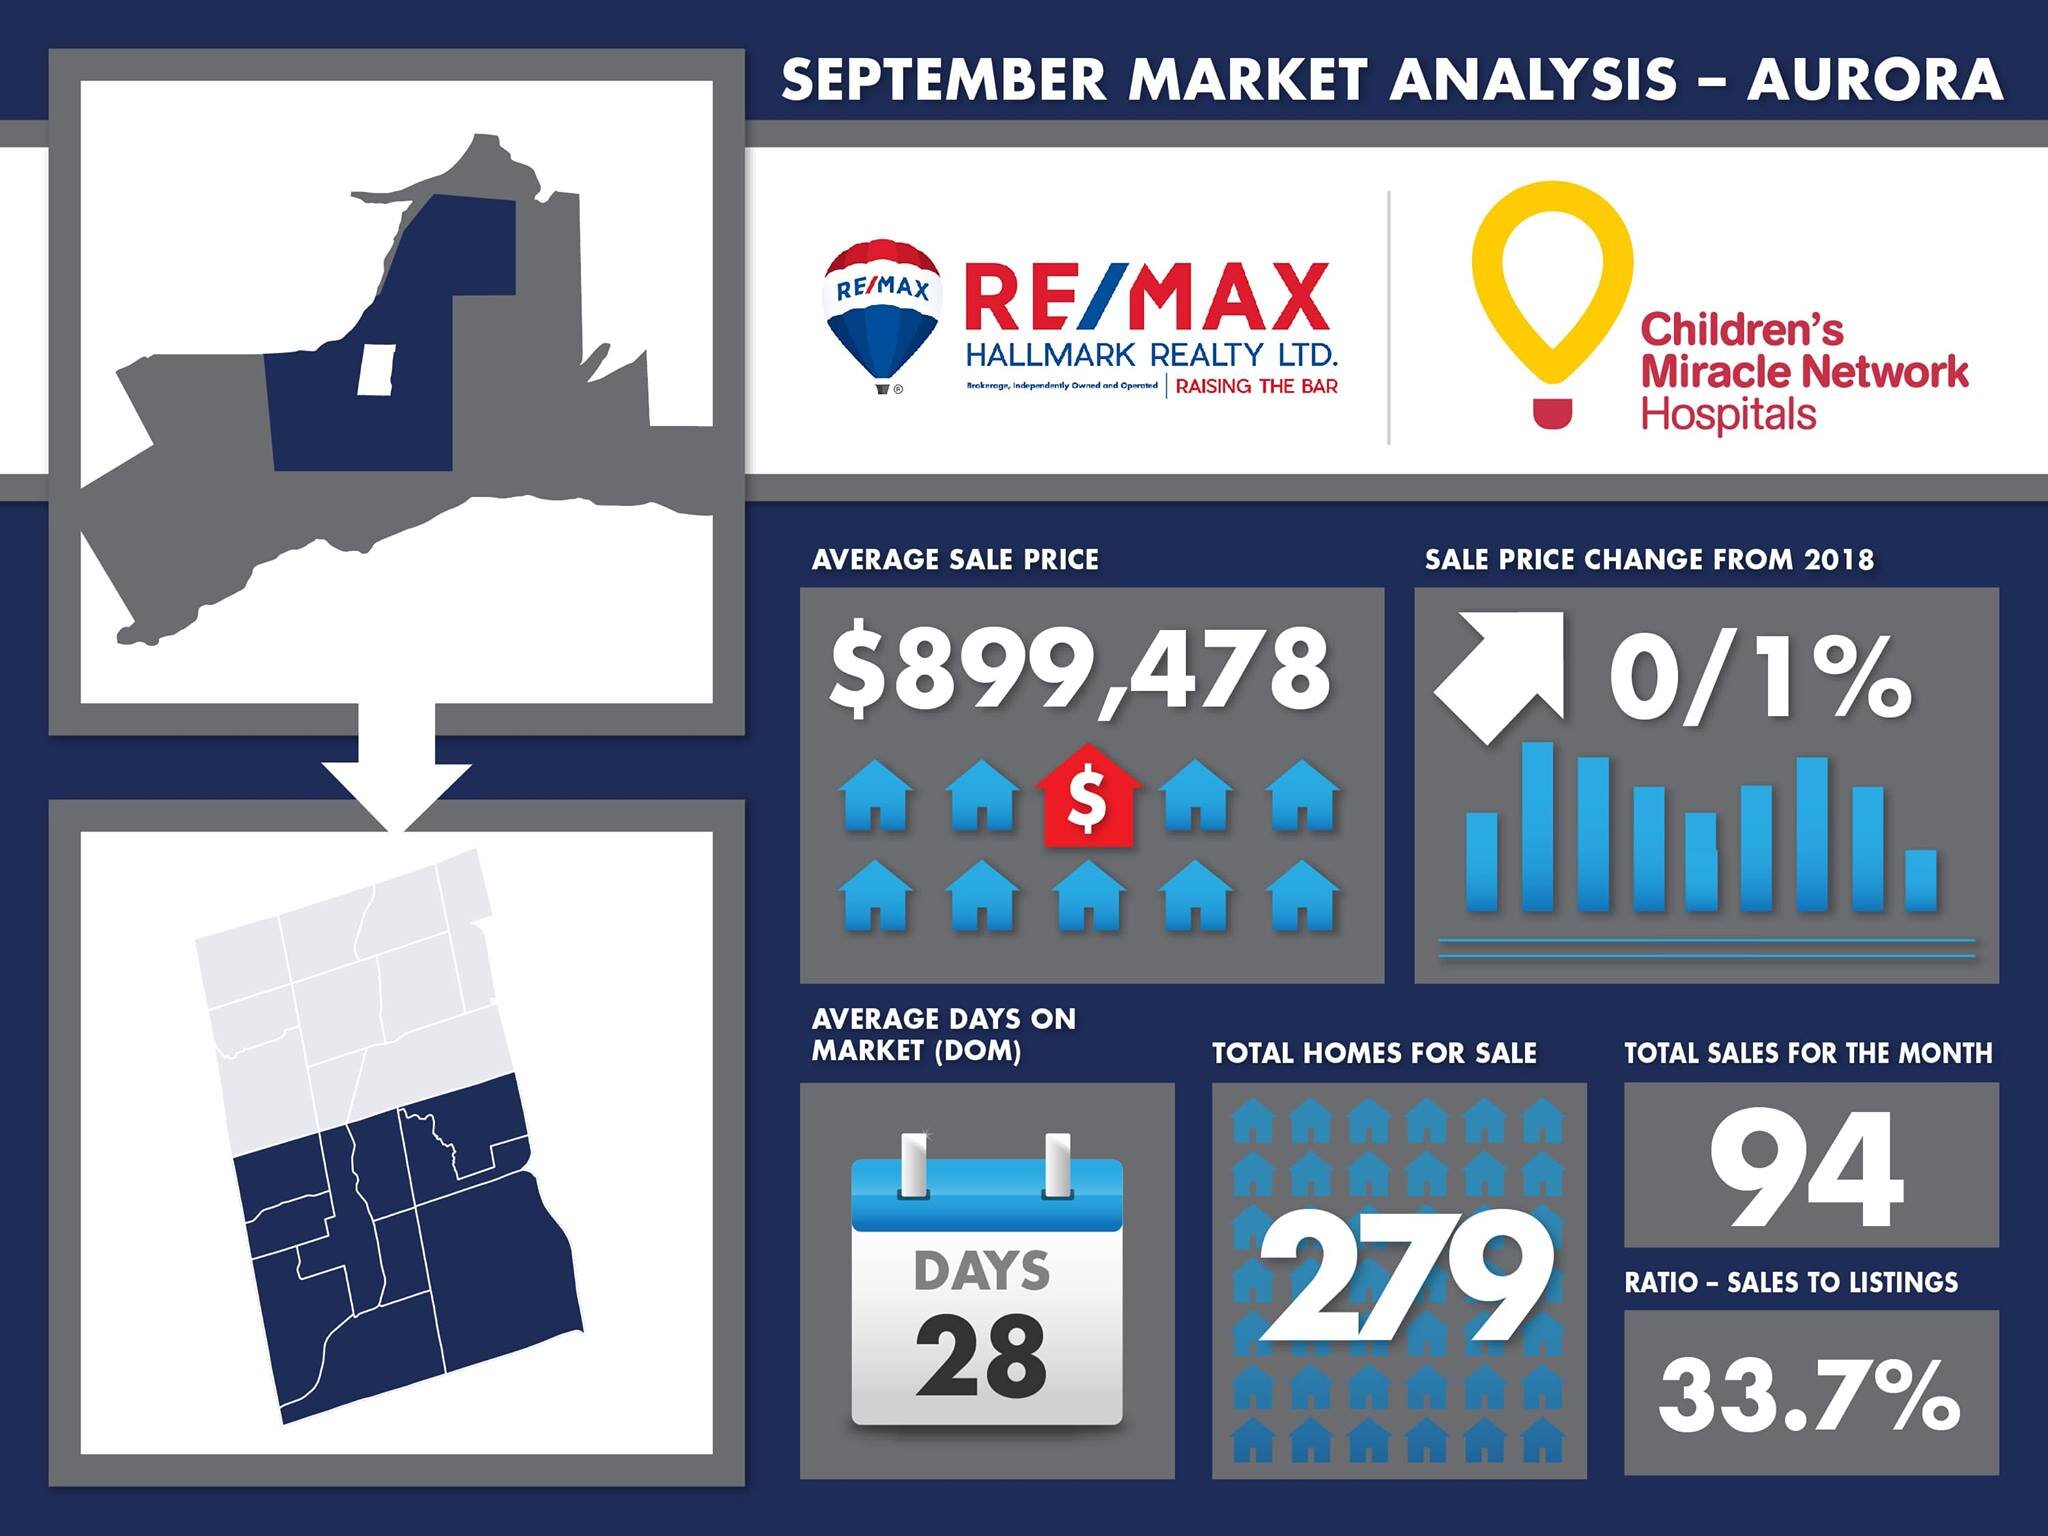
*Source - Remax.ca

Do Staged Homes Sell Faster?

For most home sellers, the goal is to sell their home for the highest possible price and in the shortest amount of time. Two ways to achieve this is with the right asking price, and by staging the property. So, do staged homes really sell faster, and for a higher price? The short answer is yes, and here’s why.
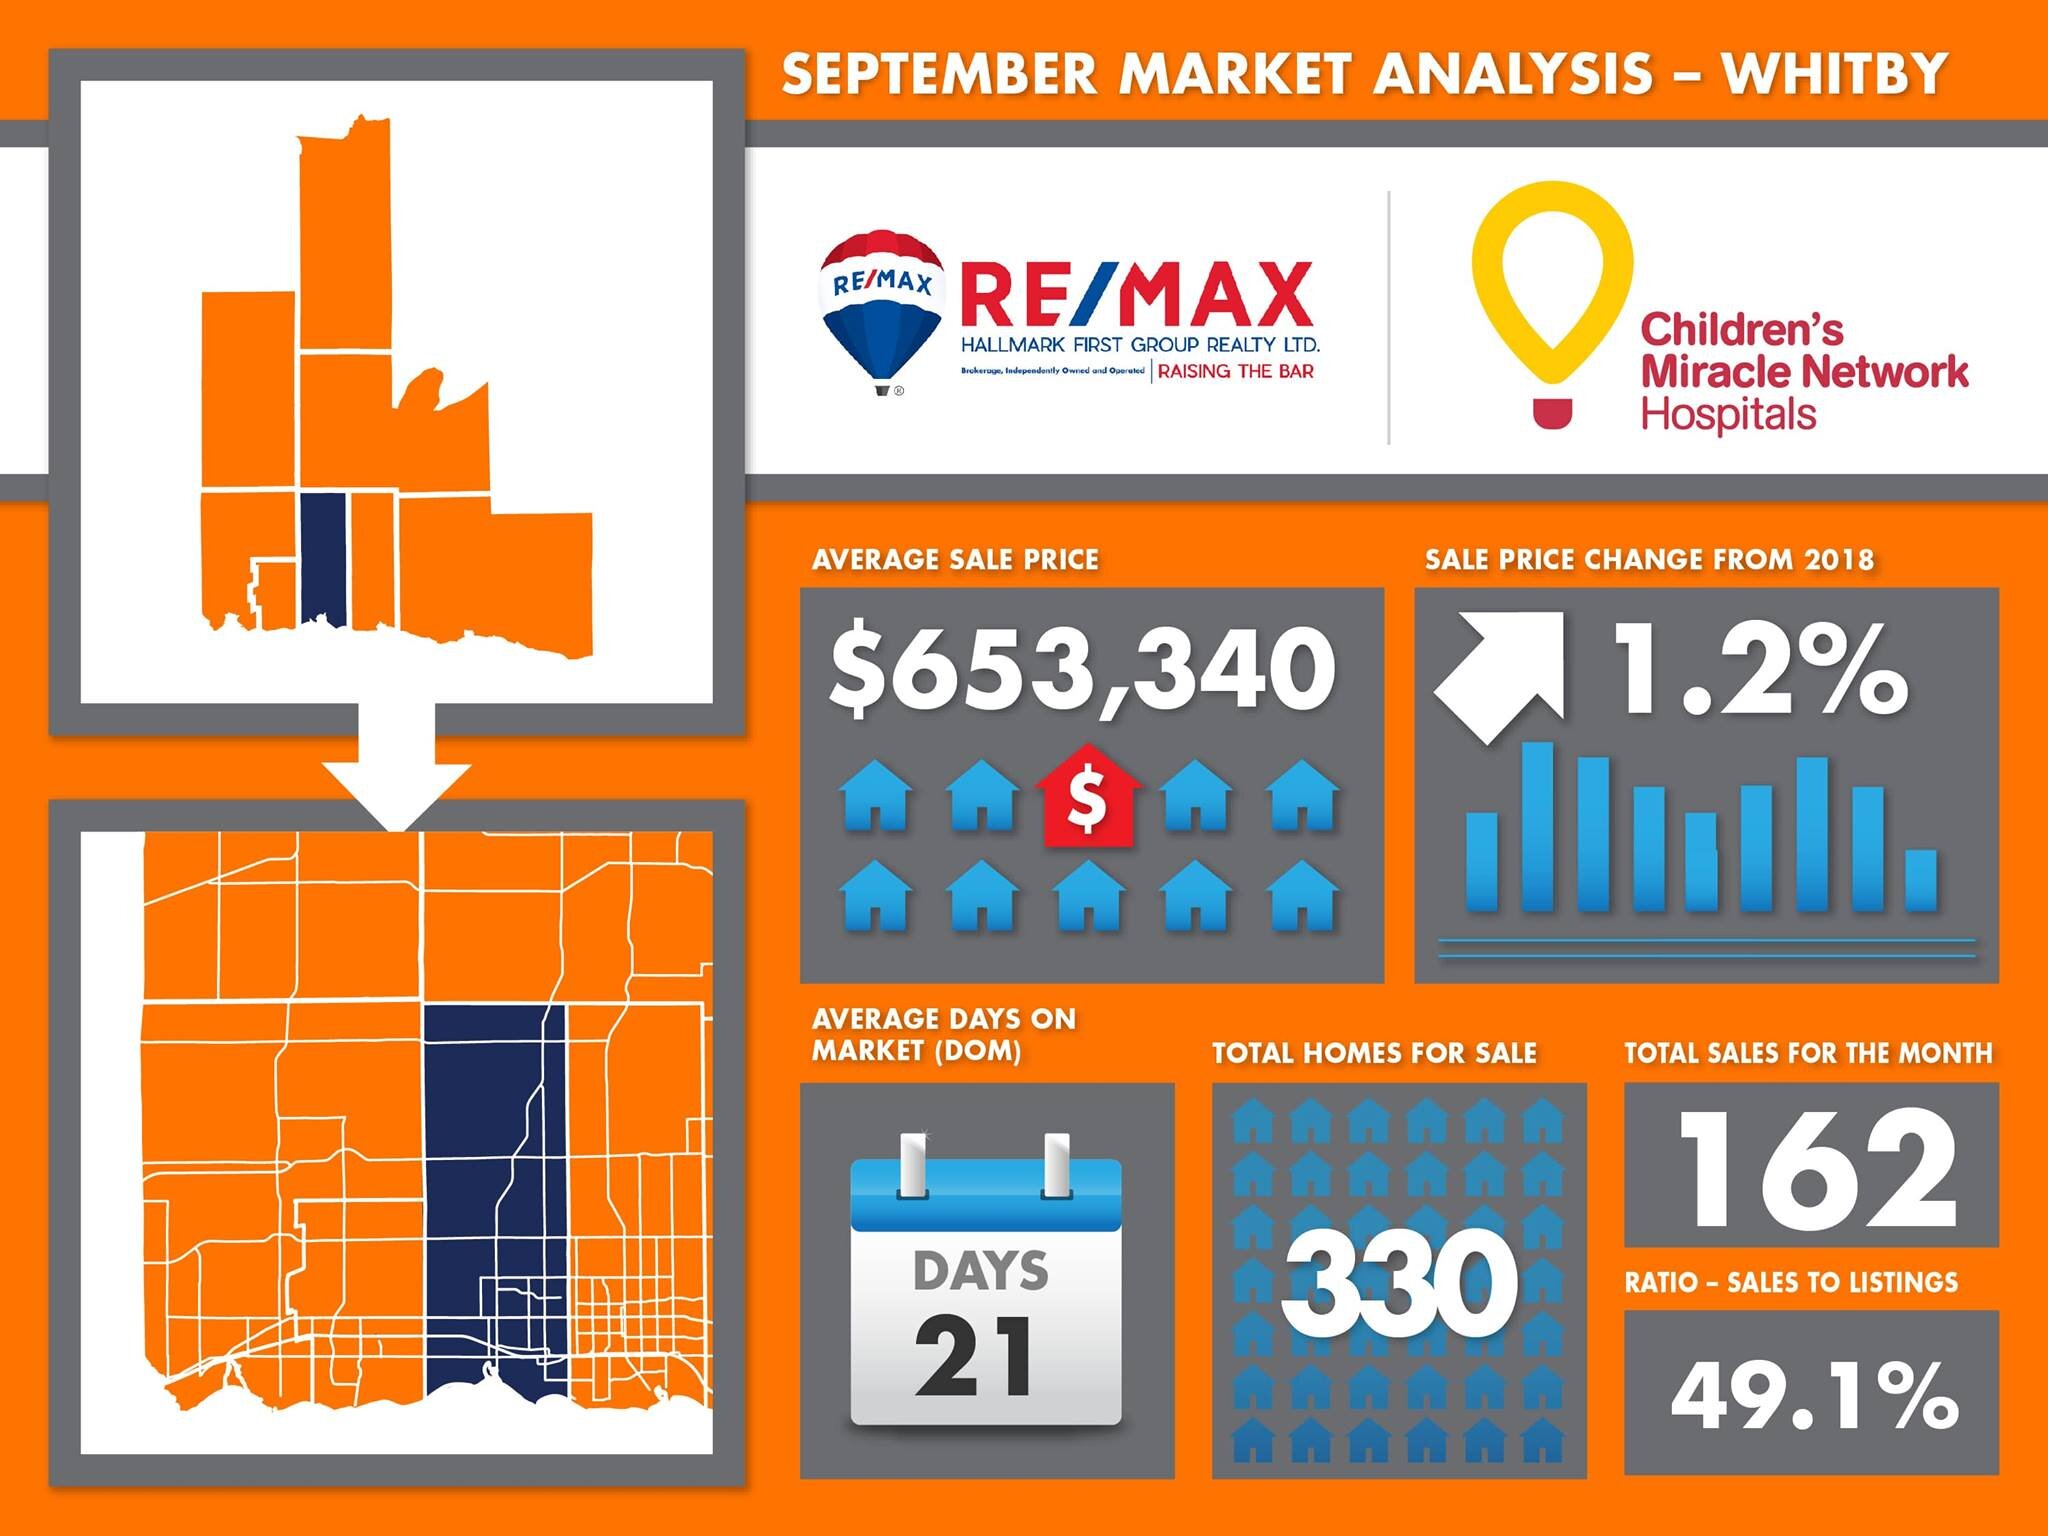
Do staged homes sell faster?

According to the Real Estate Staging Associationstaged homes spend 73 per cent less time on the market than their un-staged counterparts. Truthfully speaking, even an un-staged home can sell under the right market conditions. A seller’s market, characterized by high demand and low inventory, generally means buyers are likely to scoop up what they can get. In a buyer’s market, there are more homes for sale than there are buyers, which means competition is greater among sellers and buyers have the upper hand. Under these circumstances, staging your property could tip the scales in your favour.

Do staged homes fetch a higher price?

The answer to this question isn’t as cut-and-dry, since the final selling price of a home depends on a number of factors. Is there buyer demand? Are there many other listings on the market competing against yours? And what about the home itself – is it well maintained, cared-for and clean? With all other things equal, a staged home is likely to leave buyers with a better impression than one that hasn’t been staged, with the potential to fetch a higher selling price.

What is home staging?

Home staging is the process of preparing a home for sale by increasing its appeal to a wide range of homebuyers. Home staging isn’t as involved as a renovation, and can involve decluttering, depersonalizing and deep-cleaning; painting the walls in a fresh, neutral hue; updating hardware and lighting; rearranging existing furniture or renting some new pieces to help show the home in the best possible light. When a buyer can see your home as their home, they are more likely to make a competitive offer.

Since the majority of homebuyers start their home hunt online, it’s important to make a good impression through your digital listing photos. Buyers will weed out the homes that don’t meet their criteria, and then proceed to an in-person or virtual showing of the homes that they are seriously considering.

Decluttering and depersonalizing the home of family photos and other personal items can help. Also consider that potential buyers need to think beyond what their eyes are showing them. Staging helps them to visualize themselves living in and using the space. Is the home an ideal place for a growing family, as a live-work space, for recreational pursuits or to enjoy retirement?

DOWNLOAD THE RE/MAX HOME STAGING GUIDE

Virtual Home Staging

A new twist on home staging is “virtual” staging, which leverages technology to digitally enhance photos in order to demonstrate the possibilities. Virtual staging is ideal for vacant properties, which pose added challenges for sellers and the buyers who are trying to imagine it as their new home. Virtual home staging eliminates the need, effort and cost associated with renting or buying furniture and accessories.

Staging a home doesn’t have to be complicated. Evaluate every room and be critical, because prospective buyers will be. Viewing your own home objectively can be difficult, especially for those who have lived in their home for a long time. A professional home stager and your real estate agent can give you an honest opinion as to what works in your home, what doesn’t, and what the seller might consider changing in order to appeal to homebuyers.

*SOURCE - remax.ca

Market Update: August 2020

Here’s a snapshot summary of the significant real estate milestones for Toronto in August 2020 as we finish the 6th month of the coronavirus pandemic.

  • August sales were 39.7% higher than last year (10,775) – a record for August on TRREB

  • The ratio of sales-to-listings declined slightly to 64.7% in August – still in busy seller market territory

  • The August average sale price came in at $951,404– 20.1% above August 2019 and the highest EVER average sale price for the GTA

  • The GTA real estate market overall averaged 17 days-on-market

  • Detached home sales in August 2020 with a purchase price over $2,000,000 were up a big 152% (377 houses) while condo apartment sales over $2M were up by a busy 260% (18 suites) compared to July 2019

  • The CONDO share of the market was steady at 28.8% during the month

  • Downtown condo active listing numbers were UP by a big 162% in C01 and by 242% in C08 from last year at this time

  • August condo sales were flat in C01 and increased in C08 by 22.3% compared to 2019

  • The downtown condo days-on-market average was 19 days in C01 and 20 days in C08

  • The ratio of sales-to-listings for condos downtown continued to show significant declines in C01 (from 62% in 2019 to 23.8%) and in C08 (from 70% in 2019 to 24.9%)

  • Even when influenced by the lower demand and higher inventories due to the virus effect, condo values still beat the averages seen in August 2019 and appreciation gains over the last 12 months stayed strong

  • August saw detached homes in the 905 appreciate by an average 18.5% while sales were up over 47%. 905 condo apartment sales were up 14.5% while average sale prices rose by 12.9%

  • It looks like pent-up buyer demand and very low interest rates will continue to spur the market throughout the fall season as long as we keep a handle on COVID case numbers

*SOURCE: Thomas Cook - RE/Max Hallmark Realty Ltd., Brokerage

Greater Toronto Real Estate Market Report: RE/Max Canada

Detached housing values have shown remarkable resilience in the first half of 2020, with 95 per cent of Greater Toronto real estate districts posting solid gains in average price, according to a report released today by RE/MAX of Ontario-Atlantic Canada.

The RE/MAX 2020 Hot Pocket Communities Report examined trends and developments in 65 Toronto Regional Real Estate Board (TRREB) districts, finding that a steep decline in the number of homes listed for sale during Ontario’s State of Emergency contributed to a notable uptick in single-detached housing values. Active listings across Greater Toronto real estate markets hovered at 14,000 in June, the lowest level for the month since 2016 when active listings bottomed-out at 12,327. Average price was up in 95% of areas between January and June 2020, compared to the same period in 2019. Double-digit increases were reported in 60% of 416 districts and in 50% of 905 districts.

“Strong demand characterized much of the first quarter of 2020, setting the stage for a record-breaking spring market in the Greater Toronto Area – and then came Covid-19,” says Christopher Alexander, Executive Vice President and Regional Director, RE/MAX of Ontario-Atlantic Canada. “In past downturns, a drop in unit sales has usually been followed by a significant upswing in the number of homes listed for sale. That didn’t happen in this case as buyers and sellers paused in April, then cautiously resumed home-buying activity as COVID-19 cases dropped and local economies re-opened. With the easing of restrictions and the province moving into the third, and perhaps final phase, we anticipate that the housing market will likely accelerate.”


Location will be top-of-mind for most homebuyers, as illustrated by this year’s top five markets (two tied in second place). Of the 65 Greater Toronto real estate districts examined in the report, RE/MAX found that the strongest gains in average price occurred in areas in close proximity to Toronto’s central core. Leading in terms of percentage increase in the average price of a detached home in the first half of 2020 is Yonge-St. Clair, Annex, Casa Loma and Wychwood (C02), where values climbed 25.7% to $2,918,968. Move-up buyers were particularly active in this area, with a shortage of homes listed for sale, particularly in the Annex. In June, there were 28 active listings, and 17 average days on market, and the sale-to-list price ratio was 98%.

With an increase of 18.4% in average price, two markets straddling the lakeshore in the east and west ends of the city ranked second in terms of price appreciation. Swansea, Roncesvalles, South Parkdale and High Park (W01) saw detached housing values climb to $2,050,596, while Oakridge, Birchcliffe-Cliffside (E06) topped $1 million, settling in at $1,095,287. Young families were a major driver in both areas, with affordability and proximity to the Beach community drawing buyers to Oakridge, Birchcliffe-Cliffside, and close proximity to the downtown core and west-end shoreline attracting purchasers to High Park, Swansea, Roncesvalles, and South Parkdale.

While C03 is home to Forest Hill South and some of the most expensive real estate in the city, the area is also comprised of affordably priced hot pockets such as Oakwood-Vaughan and Humewood. The average price of a detached home in C03 is up 17.7% to $2,371,546, although a small bungalow in the aforementioned neighbourhoods can be purchased for just over $1 million. The same holds true for W08, home to the tony Kingsway South, but also offers up detached homes starting at just under $1 million in neighbourhoods such The West Mall. Average price in W08 was up 17% in the first half of the year, compared to the same period one year ago, rising to $1,693,382Alderwood, Long Branch, New Toronto and Mimico in W06 have also been on an upward trajectory in recent, with the average price of a detached home rising 16.2% to $1,202,176.

While sales of detached homes were down overall, RE/MAX found several suburban/rural districts that bucked the trend, showing signs of growth. Most were located in more suburban/rural areas of the Greater Toronto Area, where the dollar stretched farther and listings were plentiful. Leading in terms of percentage increase in detached housing sales was the King area in York Region where 161 detached properties changed hands, up from 117 one year earlier, representing a 37.6% upswing in volume. Just under 200 active listings were available for sale in June, average days on the market hovered at 44, while the sales-to-list price ratio was 93%.

Bridle Path, Sunnybrook, York Mills, St. Andrew, and Windfields (C12), the only district in the 416 to post an uptick in sales, claimed second place for sales. The area, the most expensive in the GTA, experienced a 20.6% increase in sales between January and June 2020, with the number of detached homes sold rising to 76, up from 63 during the same period in 2019. Days on market were 19, with a sales-to-list price ratio of 94%. Close to 100 homes were listed for sale in June.

Affordability was the common denominator in the third, fourth and fifth place finishes, all with an average price between $600,000 and $650,000. Simcoe County’s Innisfil posted strong gains, ranking third with a 14.4% increase bringing the number of sales in the area to 389, up from 340 in 2019.  Days on market were 35, sales-to-list price ratio was 99%, and more than 220 active listings were available in June. Fourth place Oshawa, in Durham Region, also proved a hot spot for sales so far this year, with more than 1,053 single-detached homes sold in the first half of the year, a 10.8% increase over 2019. Detached homes are moving quickly, with average days on market at 16, the sales-to-list price ratio is 101%, and 200 active listing available for sale in June. Rounding out the top five was Georgina in York Region, with 373 detached homes sold in the first six months of the year, up 9.1% over the 342 sales reported during the same period last year.

“While the strength of the market is underscored by rebounding economic fundamentals, it’s clear that we are not out of the woods yet, given what’s happening around the world,” explains Alexander. “Having said that, the manner in which government has handled Covid-19 has been exemplary, and while there may have been some missteps along the way, we have all benefitted from leadership at all three levels. I’m confident that under their continued guidance and direction, we will be able to navigate any and all stormy waters ahead, and that bodes well for the economy and the housing market overall.”

*Source - https://blog.remax.ca/greater-toronto-real-estate-market-report-re-max-canada/?utm_campaign=OA%20PR%20Reports&utm_medium=email&_hsmi=91683689&_hsenc=p2ANqtz-8zlkpmsDVfj2SjVGv0fWqFkHIgCahlaq5H_921JQ_cjZVgoNdXJegZo_1Ap2H5EJIRcjHM9mXv_9geDwmiKvftJPqucQ&utm_content=91683689&utm_source=hs_email

RE/MAX Hallmark 2020 Scholarship

RE/MAX Hallmark is once again offering the Scholarship Program!
 
This program has been a tremendous success since starting in 2007.  We have awarded over $175,000 for post-secondary education to eligible children of Clients and Administrative Staff.
 
This year the Scholarship Fund is $25,000 for the 2020 Fall Semester of post-secondary education.  The funds are to be shared amongst present and past clients of RE/MAX Hallmark realtors that are selected. We encourage you to connect with your clients and promote this program as it will benefit them and yourself. 
 
Please note, REALTORS children or family members are not eligible for the Scholarship Program.  This program is designed to benefit your clients.  
 
Deadline to accept applications for our 2020 Fall Scholarships is April 17th.  Please contact us for the program’s complete criteria and application form. 

If you require further information, or would like to obtain an application form, please contact Alicia at 416.494.7653 or via email at alicia@connexusgroup.ca.  We would be happy to endorse your child in our Scholarship Program to help with their education

 At RE/MAX Hallmark, we feel strongly about contributing to the minds of tomorrow and investing in the future of our children.  

Best of luck, 

Ravi, Justin, Ashley, Sabrina, Alicia and Angela
#theconnexusadvantage

The Time is Now: Planning for Growth in the GTA

TREB Market Year in Review and Outlook Report

This year's report, subtitled The Time is Now: Planning for Growth in the GTA, explores some of the most important market issues affecting our industry today. Published February 2020

This is the fifth edition of our
Market Year in Review & Outlook Report,
a report that I am immensely proud to have
seen grow over the years into a must-read, not
only by those with an interest in the Greater Golden
Horseshoe (GGH) real estate market, but also by those
with a keen interest in seeking solutions to improve
the quality of life in this region.
— John DiMichele CEO, Toronto Regional Real Estate Board

This years report Highlights the following Key Topics:

2020 Housing Forecasts (Page 13)

Rental Market Outlook (Page 17)

Commercial Market Outlook (Page 27)

Policy makers commentary from all major Municipality Mayors (Page 31)

Transportation proposed solutions for Population Growth (Page 41)

Click here for the 2020 Report

Click here for a mobile friendly, single column version of the Report

Click here for a user-friendly flip version of the Report

*Source Toronto Real Estate Board TREB February 2020


State of the Market Episode 3.7 | Review of REMAX 2020 Housing Outlooks and Ravi's Predictions

On the last episode of State of the Market for 2018, Ravi discusses the REMAX 2020 Outlook and discusses insight on his own predictions for this year…

*Facebook Live December 30th 2019

Ravi Singh was name one of the most Interesting People in Real Estate by Inman News in 2016. Award winning Realtor with ReMax Hallmark and team leader at The Connexus Group.

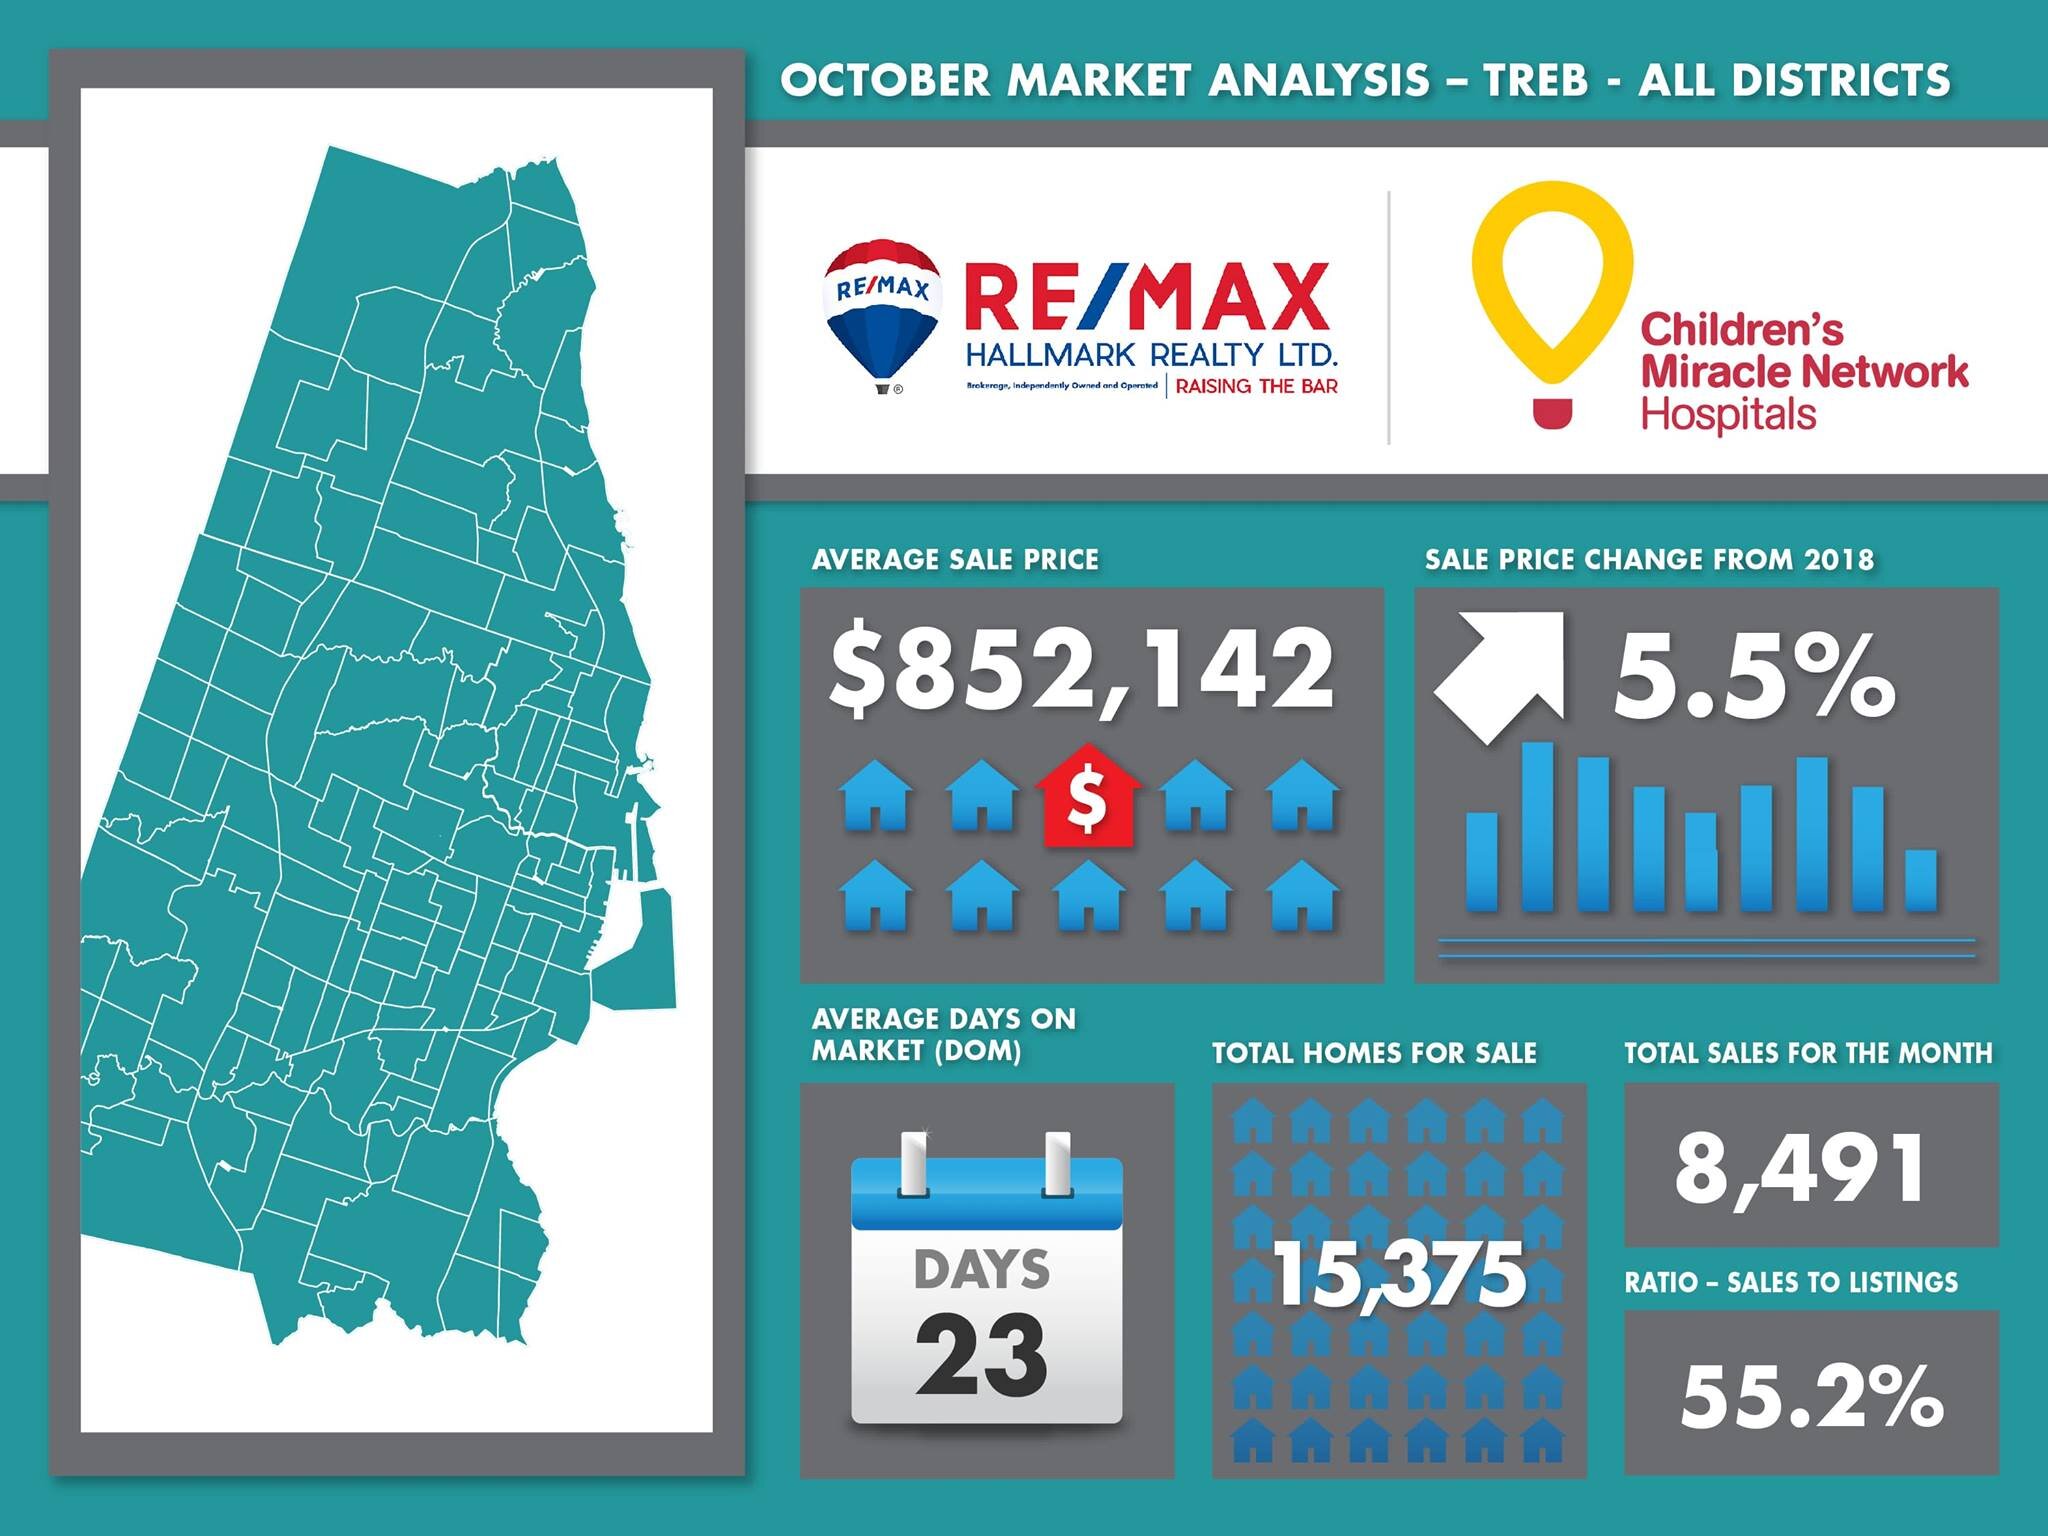
October Market Statistics

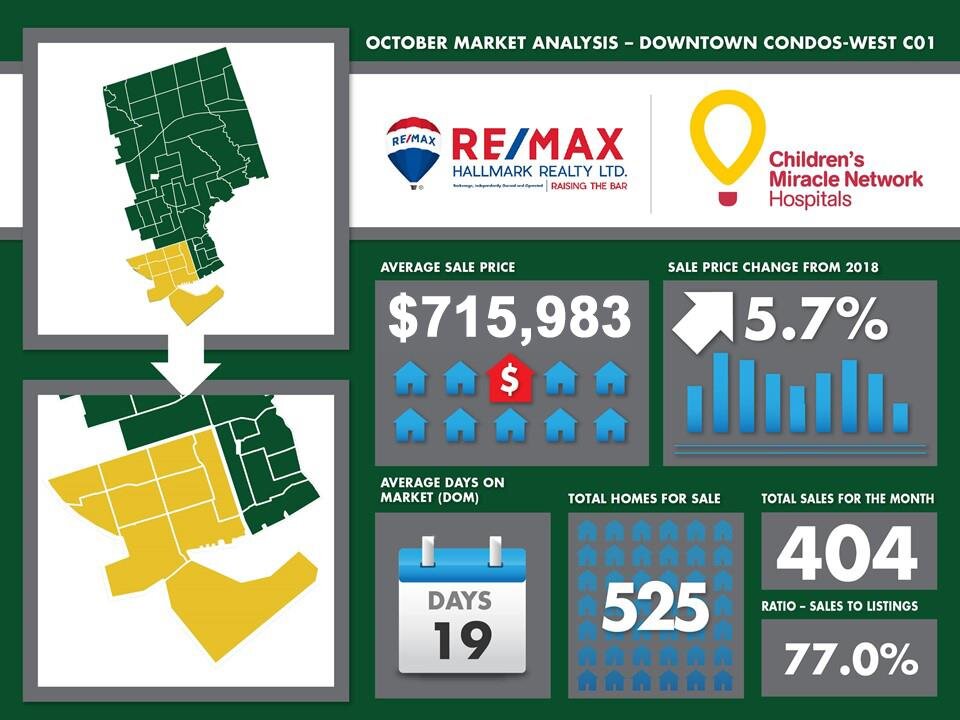
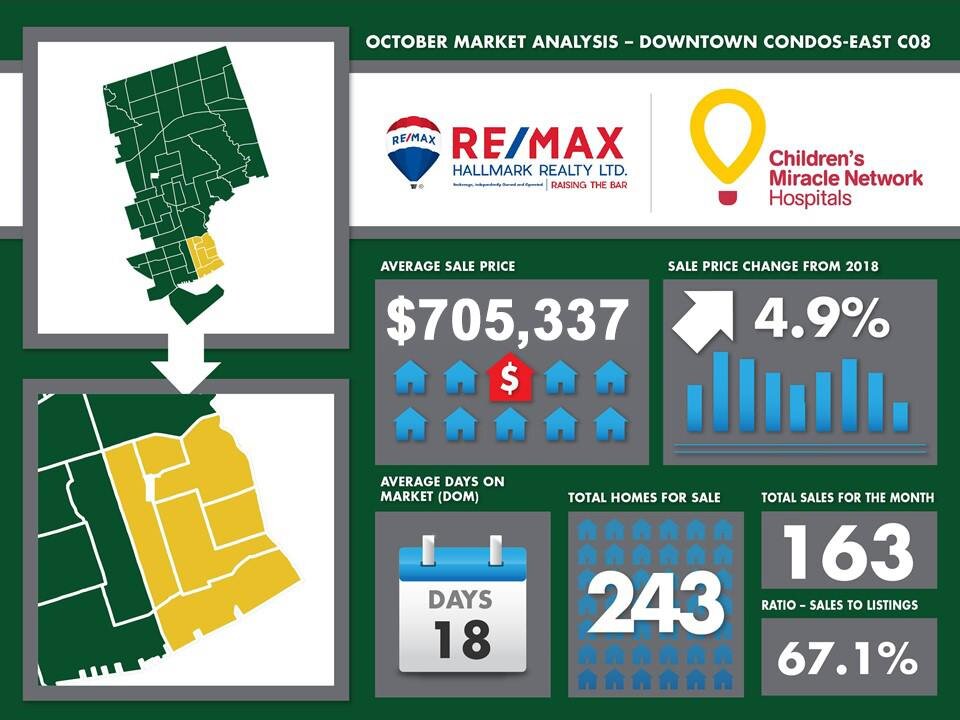
Here’s a snapshot summary of the significant real estate milestones for Toronto in October 2019… the highest average sale price so far in 2019!!

  • October sales up 13.8% compared to last year (8,491)

  • The ratio of sales-to-listings jumped up to 55.2% in October

  • The average sale price came in at $852,142– up a positive 5.5% compared to last year

  • Note that this overall market average # is the highest we’ve seen all year

  • The GTA real estate market overall averaged 23 days-on-market

  • Detached home sales in October 2019 with a purchase price over $2,000,000 were up 5.4% (213 houses) while condo apartment sales over $2M were up 108% (25 suites)

  • The CONDO share of the market was steady at 34% during the month

  • Downtown condo active listing numbers were down 3.1% in C01 and increased in C08 by 4.3% from last year at this time

  • October condo sales were up 2.5% in C01 and up in C08 by 14% compared to 2018

  • The downtown condo days-on-market average was 18-19 days – 4-5 days faster than the overall market

  • The ratio of sales-to-listings for condos downtown was somewhat matched in C01 (77%) and in C08 (67.1%) but both were still much higher than in the overall market (55.2%).

  • Building on this higher demand due to better affordability, condo appreciation in the two main downtown markets averaged 4.9% to 5.7% year-over-year… consistent with what we’ve been seeing all this year.

  • Sales numbers have now increased in many 905 neighbourhoods although appreciation percentages are lower across the board in the 905.

  • October is the mid-point of our fall market and we can typically expect sales numbers to slow as we go through November and close in on the Xmas holiday season.

*Source - Thomas Cook Remax Hallmark Realty Ltd., Brokerage

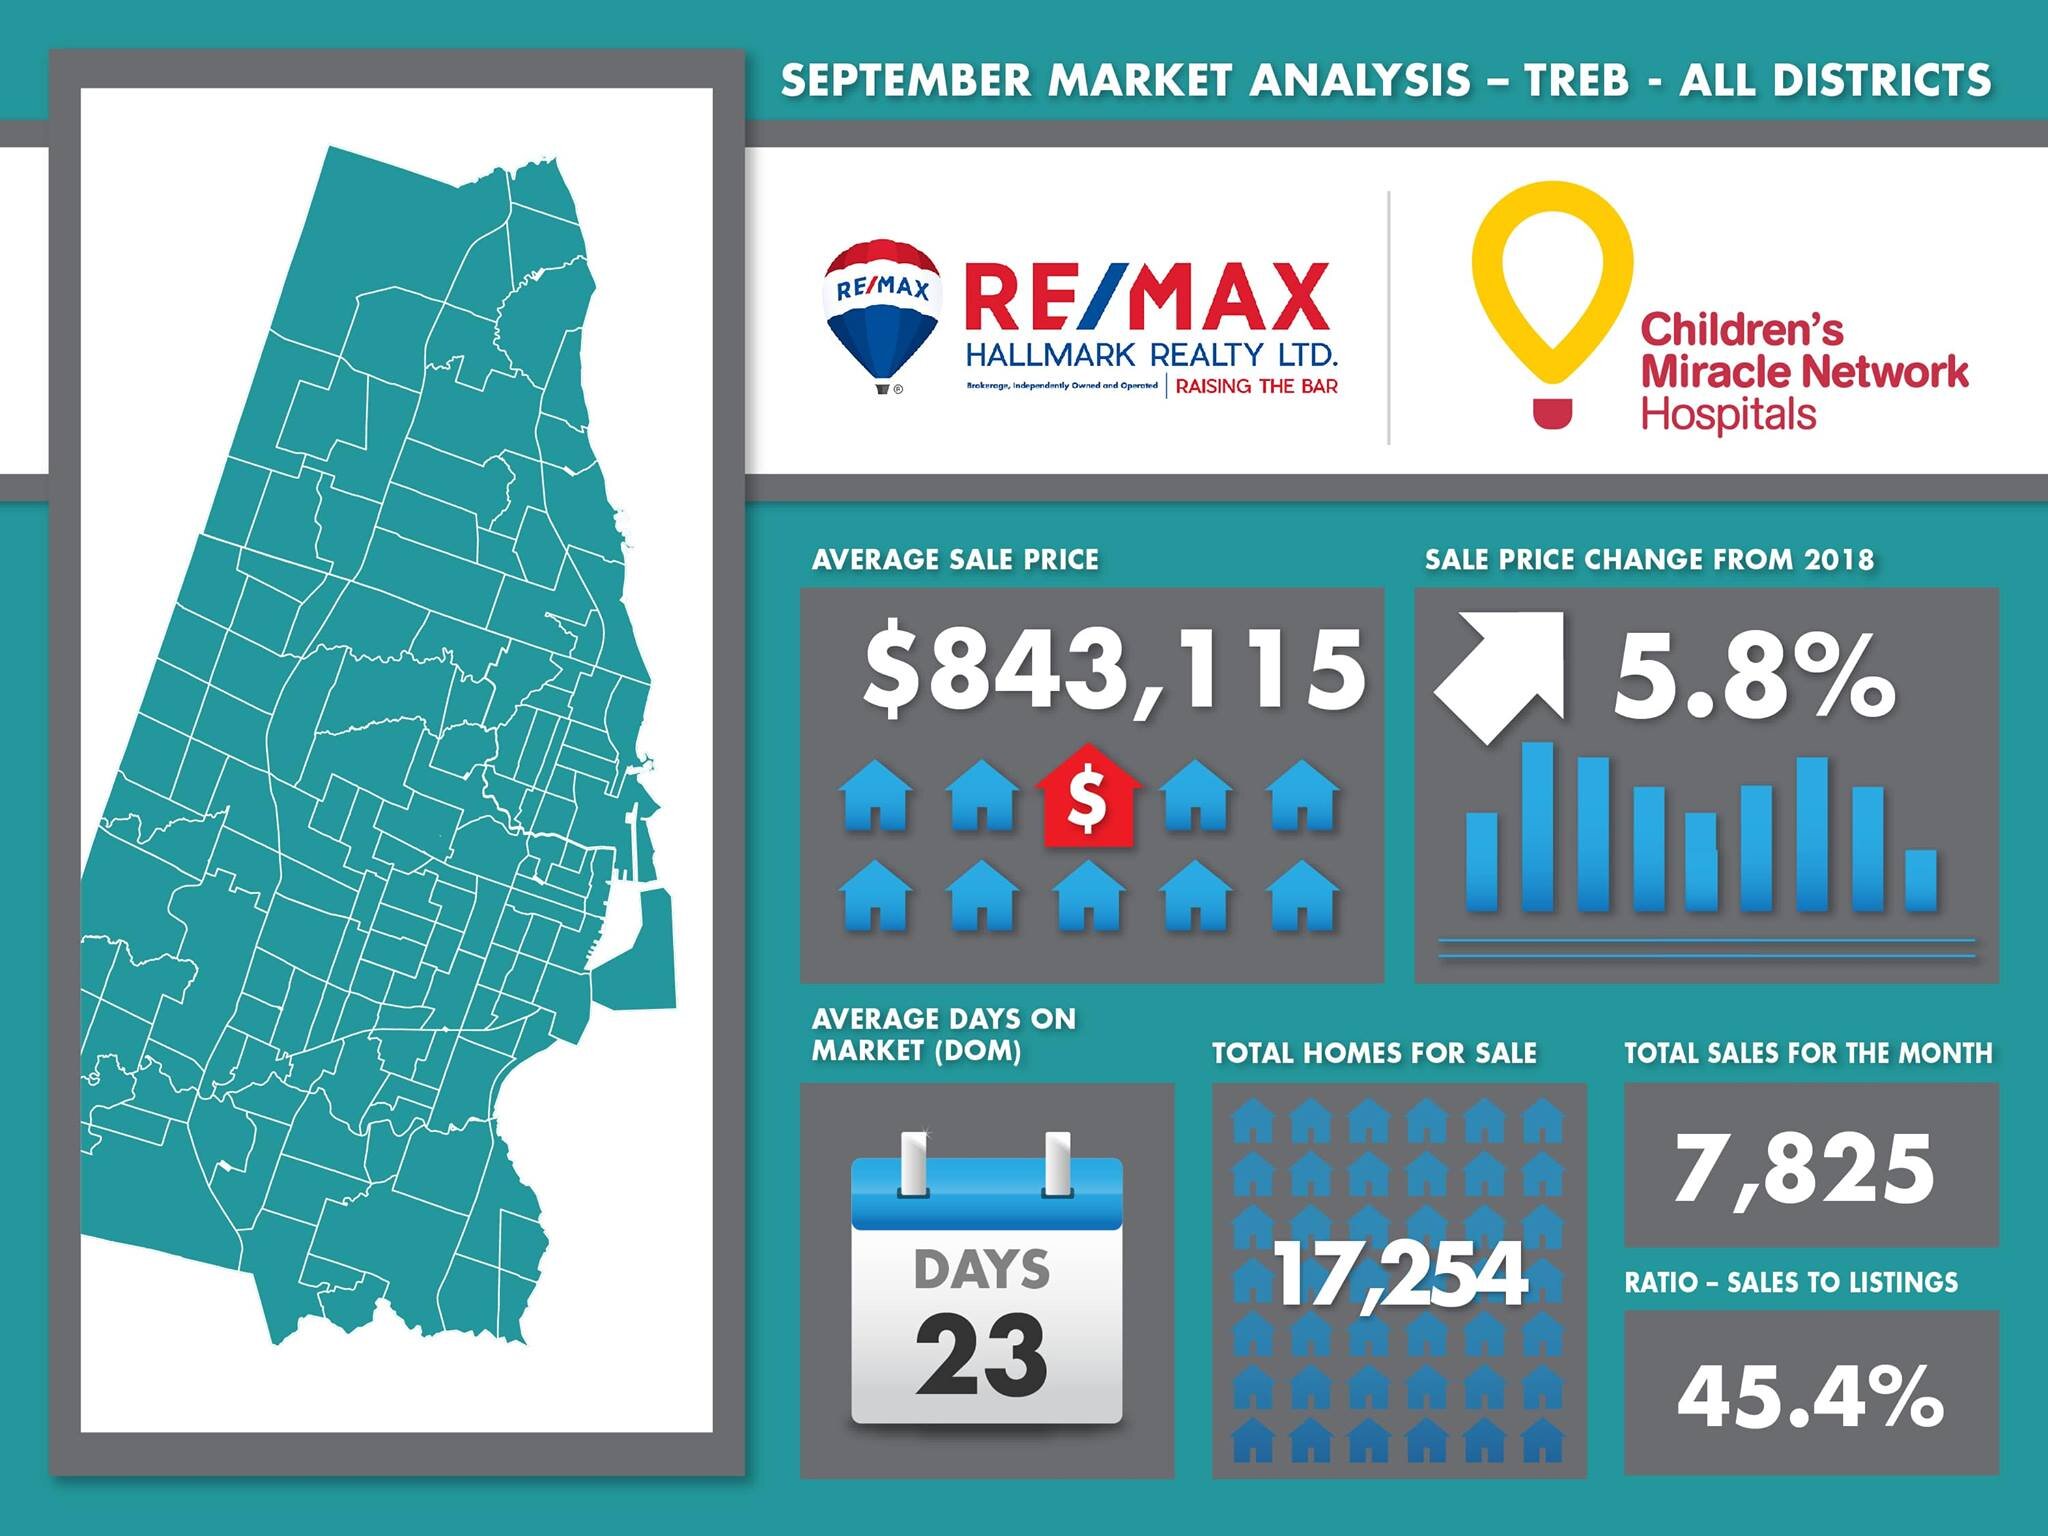
Septemer Market Statistics

Here’s a snapshot summary of the significant real estate milestones for Toronto in September 2019… the highest year-over-year appreciation number in 2019!!

  • September sales up 22% compared to last year (7,825)

  • The ratio of sales-to-listings dropped very slightly to 45.4% in September

  • The average sale price came in at $843,115 – up a positive 5.8% compared to last year

  • Note that this overall market average is almost 9% higher than the average 2 years ago in September 2017

  • The GTA real estate market overall averaged the days-on-market at 23

  • Detached home sales in September 2019 with a purchase price over $2,000,000 were up 32% (218 houses) while condo apartment sales over $2M were up 14% (16 suites)

  • The CONDO share of the market was steady at 34% during the month

  • Downtown condo active listing numbers were up 8.6% in C01 and increased in C08 by 13% from last year at this time

  • September condo sales were down 7% in C01 and up in C08 by 19% compared to 2018

  • The downtown condo days-on-market average was 18-22 days – 1-5 days faster than the overall market

  • The ratio of sales-to-listings for condos downtown was somewhat matched in C01 (52.8%) and in C08 (68.3%) but both were still much higher than in the overall market (45.4%).

  • Building on this higher demand due to better affordability, condo appreciation in the two main downtown markets averaged 4.3% to 5.3% year-over-year… consistent with what we’ve been seeing all this year.

  • Sales numbers have now increased in many 905 neighbourhoods although appreciation percentages are lower across the board in the 905.

  • September usually means the start of the fall market where more condos and houses are listed and sales increase from the summer months although that didn’t happen this year. This trend may follow through for the rest of the fall market thru the end of November.

*Source Thomas Cook, Remax Hallmark Realty Ltd., Brokerage

Press Release: Bank of Canada keeps rates the same

The Bank of Canada today maintained its target for the overnight rate at 1 ¾ per cent. The Bank Rate is correspondingly 2 per cent and the deposit rate is 1 ½ per cent.

Global economic growth has slowed by more than the Bank forecast in its January Monetary Policy Report (MPR). Ongoing uncertainty related to trade conflicts has undermined business sentiment and activity, contributing to a synchronous slowdown across many countries. In response, many central banks have signalled a slower pace of monetary policy normalization. Financial conditions and market sentiment have improved as a result, pushing up prices for oil and other commodities. 

Global economic activity is expected to pick up during 2019 and average 3 ¼ per cent over the projection period, supported by accommodative financial conditions and as a number of temporary factors weighing on growth fade. This is roughly in line with the global economy’s potential and a modest downgrade to the Bank’s January projection.

In Canada, growth during the first half of 2019 is now expected to be slower than was anticipated in January. Last year’s oil price decline and ongoing transportation constraints have curbed investment and exports in the energy sector. Investment and exports outside the energy sector, meanwhile, have been negatively affected by trade policy uncertainty and the global slowdown. Weaker-than-anticipated housing and consumption also contributed to slower growth.

The Bank expects growth to pick up, starting in the second quarter of this year. Housing activity is expected to stabilize given continued population gains, the fading effects of past housing policy changes, and improved global financial conditions. Consumption will be underpinned by strong growth in employment income. Outside of the oil and gas sector, investment will be supported by high rates of capacity utilization and exports will expand with strengthening global demand.  Meanwhile, the contribution to growth from government spending has been revised down in light of Ontario’s new budget.

Overall, the Bank projects real GDP growth of 1.2 per cent in 2019 and around 2 per cent in 2020 and 2021. This forecast implies a modest widening of the output gap, which will be absorbed over the projection period.

CPI and measures of core inflation are all close to 2 per cent. CPI inflation will likely dip in the third quarter, largely because of the dynamics of gasoline prices, before returning to about 2 per cent by year end. Taking into account the effects of the new carbon pollution charge, as well as modest excess capacity, the Bank expects inflation to remain around 2 per cent through 2020 and 2021.

Given all of these developments, Governing Council judges that an accommodative policy interest rate continues to be warranted. We will continue to evaluate the appropriate degree of monetary policy accommodation as new data arrive. In particular, we are monitoring developments in household spending, oil markets, and global trade policy to gauge the extent to which the factors weighing on growth and the inflation outlook are dissipating.

Information note

The next scheduled date for announcing the overnight rate target is May 29, 2019. The next full update of the Bank’s outlook for the economy and inflation, including risks to the projection, will be published in the MPR on July 10, 2019.

*Source Bank of Canada April 24, 2019

Province unveils plans to alter four big transit projects

Premier Doug Ford has unveiled his vision for a transit plan that would introduce some major changes to several transit projects that are already underway in Toronto.  

The plan would see the provincial government commit $11.2 billion to an overall plan that would cost $28.5 billion.

The announcement Wednesday includes plans for the downtown relief line, the Scarborough subway extension, the Yonge North subway extension of Line 1, and the Eglinton West LRT project.

The provincial plan would rely heavily on further investment from the federal government, seeking up to 40 per cent of the cost from Ottawa. That 40 per cent stake would include $4.8 billion in previous federal commitments to transit infrastructure in Toronto. The province is hoping that $2.25 billion of the extra $6.6 billion that it wants from Ottawa will come through the green infrastructure stream.

The plan would also rely on “significant investments” from the city of Toronto and York Region.

While the exact numbers have not yet been worked out, Ford said that discussions with the city have been positive so far.

While the premier said that provincial and municipal officials have spent “hundreds” of hours discussing the plan, it’s not clear how much the city knows so far about what the province is asking. Mayor John Tory did not attend Wednesday’s announcement, saying he could not attend an announcement about an infrastructure project that he doesn’t know anything about.

Describing it as “fabulous” and “the best ever,” Ford said the new transit system would serve the GTA for the next 50 to 100 years and added that the province is able to build transit “faster, better, cheaper” than the city.

“We’re going to get the largest system in Canada moving,” Ford said.

Asked what he would do if the federal government does not come to the table with the funds, Ford said the province would be willing to foot the entire bill and said he’d be willing to stake his reputation on the plan.

“If need be, we’ll backstop it ourselves,” he said

Major changes to relief line

Some of the most drastic changes affect the planned downtown relief line.

The provincial plan would rename the relief line “The Ontario Line” and would change the project from a subway line that connects with the rest of the TTC system into a “free-standing transit artery.”

The province says that driverless trains, lighter, smaller and more frequent vehicles and elevated track portions could all be part of the new line.

While it appears that the technology for building the route has not yet been decided, the government says that it will “invite the market” to offer cheaper technologies.

The alignment is also different from what the city has planned so far. Current plans for the downtown relief line envision it running between Pape and Osgoode stations. According to the province, the Ontario Line would connect Ontario place downtown with the Ontario Science Centre near Don Mills Road and Eglinton Avenue , also connecting at East Harbour GO, Pape, Queen and Osgoode stations.

The line would cost $10.9 billion and would have an estimated completion date of 2027.

The latest estimate for the city’s relief line plan is $7.2 billion. TTC staff have said that they were expecting more detailed design work for the line to be compete early next year, along with an updated cost estimate.

Scarborough subway extension

The province also plans to spend $5.5 billion to build a three-stop subway extension in Scarborough instead of the planned one-stop extension.

“This one’s for you, Rob,” Premier Ford said in a nod to his late brother and former mayor Rob Ford, who championed the idea of building a subway in Scarborough.

The Scarborough extension, as envisioned by the province, would include stops at Lawrence East, Scarborough Town Centre and McCowan Road.

City council had previously considered building the three-stop subway, but had rejected it over cost concerns.

The change would add $1.6 billion to the latest cost estimate for building the one-stop subway. Ford said Wednesday that the province is willing to pay the entire cost of the Scarborough extension if need be.

The estimated completion date for the project would be 2029-2030, according to the province.

Yonge North Subway extension

Ford said the extension of Line 1 along Yonge Street from Finch Station to Richmond Hill Centre would be fast-tracked so that it is built concurrently with the Ontario Line.

Various levels of government have committed to eventually building the extension, but the TTC has said that it would not make sense to do so until there is a relief line, as the extension would likely add passengers to an already overwhelmed subway line.

Ford said the $5.6 billion project would only open after the proposed Ontario Line is built.

Eglinton Crosstown West

The provincial plan would alter the planned Eglinton West LRT project so that the line is buried between Royal York Road and Martin Grove Road.

The project would cost $4.7 billion with an estimated completion date of 2031.

The province said that it would like to ultimately connect the line to the airport, but that part is not planned currently.

First part of subway upload coming this spring

The province also says that it will split a planned upload of the TTC subway system into two parts. The first part of the upload would give the province responsibility for building all new subway infrastructure. The province says legislation will be introduced this spring to make that happen.

Discussions would then continue with the city about the upload of existing subway infrastructure, with an aim of introducing legislation to do so sometime next year.

According to a recent report by city staff, the city has already spent roughly $224 million over the past few years on planning for priority transit projects.

It’s not clear how much of that planning is still relevant given the provincial changes. However Ford said Wednesday that none of that work will have been wasted.

“We’re going to utilize every bit of the planning,” he told reporters.

Province says it can build faster, cheaper

According to background documents, provincial officials believe for several reasons that they are better positioned to deliver major transit infrastructure projects that the city is.

Those reasons include the ability to amortize costs over long periods, streamlining of permits and approvals, and the ability to relocate utilities where need be.

“The mayor understands. He doesn’t have the funds,” Ford said.

He reiterated that while he thinks the TTC is good at operating subway systems, he doesn’t think it is good at building them.

“It’s not their fault. They just can’t get it done,” Ford said.

The province believes that it can deliver cheaper transit infrastructure more quickly by changing the delivery method from the tradition plan-bid-build model. The province said it will seek public-private partnerships to try and build some of the new transit infrastructure.

Mayor John Tory is expected to comment on the provincial plan later this afternoon. 

*Source - https://www.cp24.com/news/province-unveils-plans-to-alter-four-big-toronto-transit-projects-1.4373196?fbclid=IwAR2fI92p4Wl-yv__W4lC2rWw7zbeBkXM8EU_6WV62LrAjqR3l2RLCktnqrY

Written by Joshua Freeman

April 9 2019